Closed
Description
This is somewhat of a weird bug, but I don't think it would be that uncommon of a use-case.
First let's see it working as expected.
If you run:
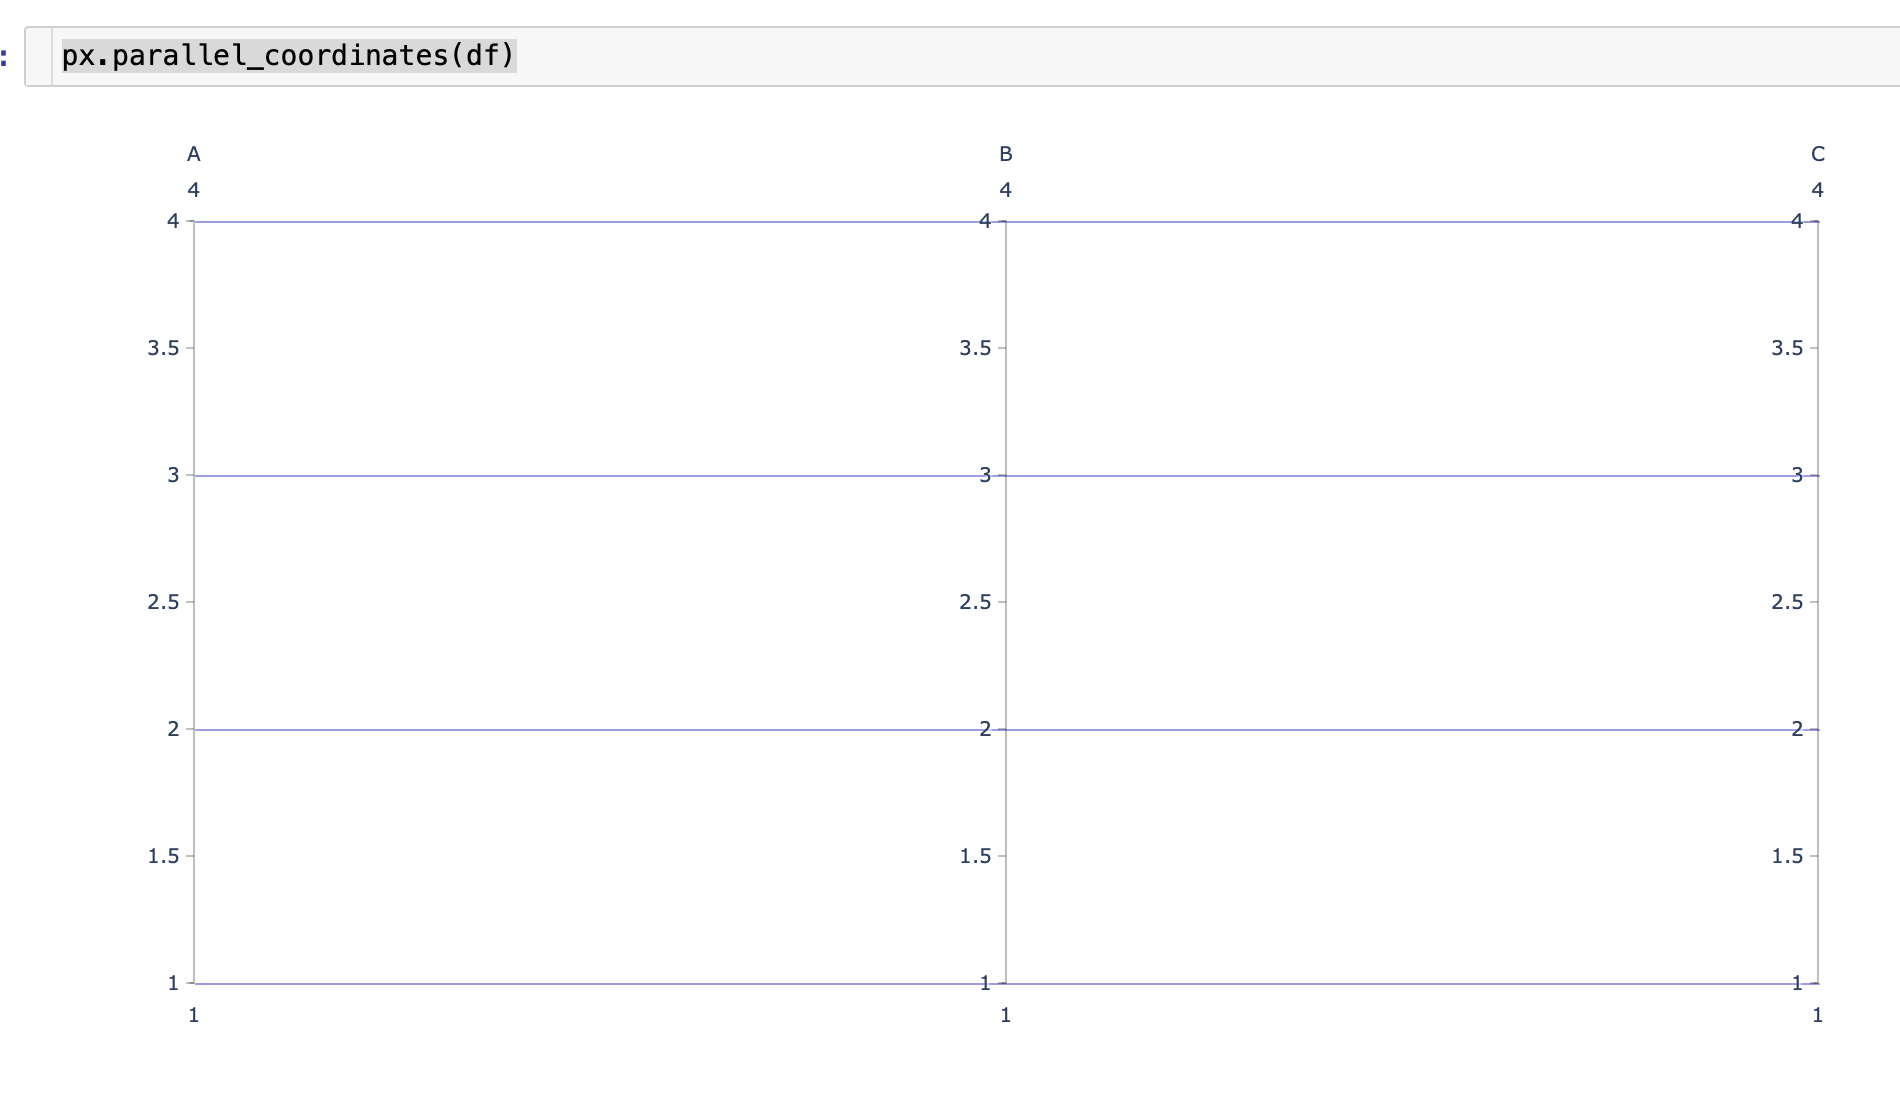
df = pd.DataFrame({
        'A': [1, 2, 3, 4],
        'B': [1, 2, 3, 4],
        'C': [1, 2, 3, 4],
    },
    index=[0, 1, 2, 3]
    #index=[3, 2, 1, 0]
)
df

px.parallel_coordinates(df)
you'll see
Then run:
px.parallel_coordinates(df, color='B')
and you'll see

Everything looks good so far.
But then change the index of the DataFrame from index=[0, 1, 2, 3] to index=[3, 2, 1, 0]
df = pd.DataFrame({
        'A': [1, 2, 3, 4],
        'B': [1, 2, 3, 4],
        'C': [1, 2, 3, 4],
    },
    #index=[0, 1, 2, 3]
    index=[3, 2, 1, 0]
)
df

px.parallel_coordinates(df)
This will return exactly the same graph as before. But when you use the color param, you get this
px.parallel_coordinates(df, color='B')

Which is incorrect. For example, instead of 1-1-1 (which is still a single row, despite the change in index), the line goes from 1-4-1.