BUG: Plotting use FixedLocator #26185
Conversation
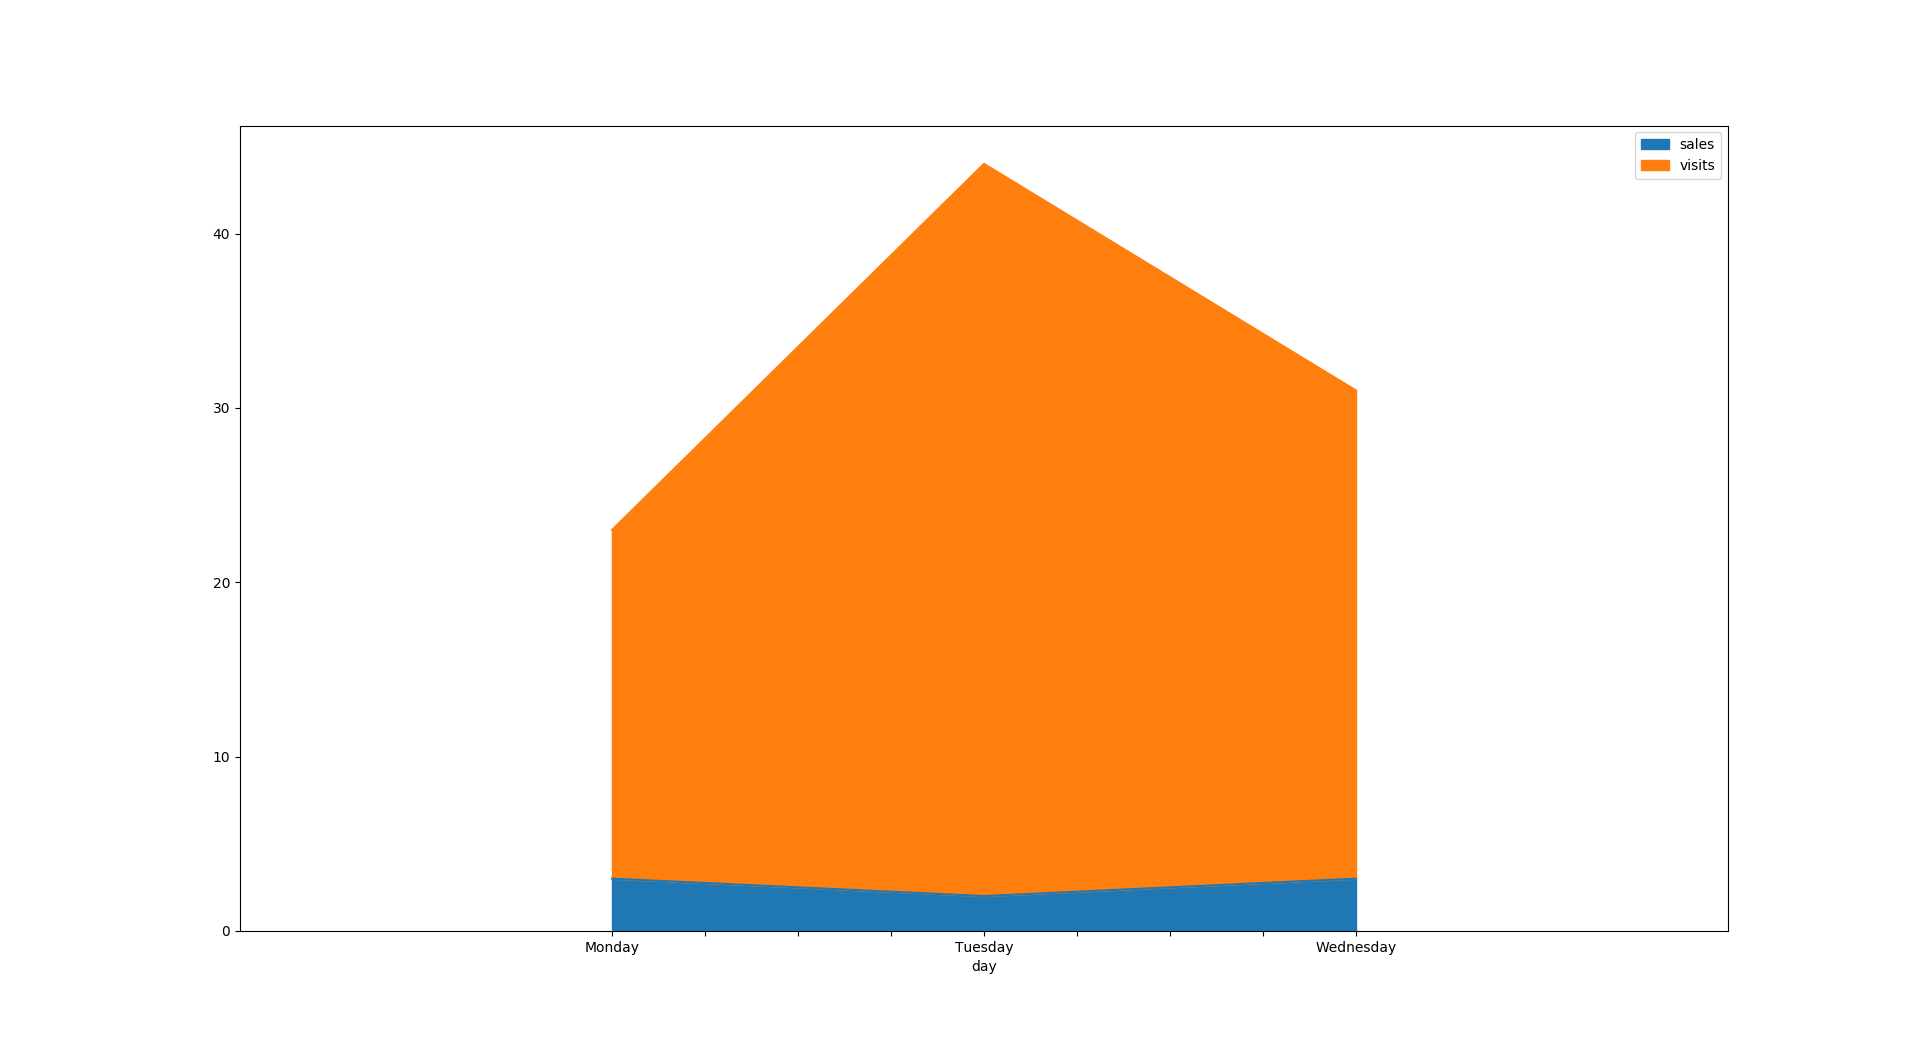
For string x values or multiindex, the axis locator is now set to a
FixedLocator for Line and Area plot. The ticklabel stay consistent
when scaling and zooming.
This impact the following issues:
GH7612, GH15912, GH22334
Codecov Report
@@            Coverage Diff             @@
##           master   #26185      +/-   ##
==========================================
- Coverage   91.98%   91.97%   -0.02%
==========================================
  Files         175      175
  Lines       52371    52379       +8
==========================================
+ Hits        48175    48176       +1
- Misses       4196     4203       +7
Continue to review full report at Codecov.
|

1 similar comment
Codecov Report
@@            Coverage Diff             @@
##           master   #26185      +/-   ##
==========================================
- Coverage   91.98%   91.97%   -0.02%
==========================================
  Files         175      175
  Lines       52371    52379       +8
==========================================
+ Hits        48175    48176       +1
- Misses       4196     4203       +7
Continue to review full report at Codecov.
|
Codecov Report
@@            Coverage Diff             @@
##           master   #26185      +/-   ##
==========================================
- Coverage   91.98%   91.96%   -0.03%
==========================================
  Files         175      175
  Lines       52371    52375       +4
==========================================
- Hits        48175    48165      -10
- Misses       4196     4210      +14
Continue to review full report at Codecov.
|
|
Please add tests to cover the issues being closed |
|
I added tests for the issue. I used the example from #22334.
This should guarantee that the xticklabel stay at the same position even after a change in the axis. |
Separate the test for pandas-dev#7612 and pandas-dev#22334, that are about string index,
and test for pandas-dev#15912, about multiindex.
|
I added the whatsnew entry, and splitted the test in two, one for string index and one for multiindex, as this was one of the difference between the issues, even if the solution is the same. |
|
does this fix #11465 ? (which is marked as a duplicate); can you add a test for this one as well. |
|
I already looked into it, and this doesnt fix #11465, and neither #2980. These are not duplicate and should maybe be reopen. |
|
thanks @nrebena |
|
welcome patches for other issues! |
| ax.set_yticklabels(yticklabels) | ||
| ax.xaxis.set_major_locator(FixedLocator(yticks)) | ||
| ax.xaxis.set_major_formatter(FixedFormatter(yticklabels)) |
There was a problem hiding this comment.
Why is the x axis given the y-tick(label)s here? Seems like an error to me.
Meaning the "horizontal" direction is not sufficiently tested.
Also note that ax.set_xticklabels(xticklabels) and ax.xaxis.set_major_formatter(FixedFormatter(xticklabels)) are redundant. One of those lines should be enough.
There was a problem hiding this comment.
This is definitly an error.
And this part is definitly not tested at all. None of the tests in plotting even hit this lines. This is because the self._need_to_set_index is only set to True for plot that have a self.orientation "vertical", so there is no way to go inside this loop.
What is the best course of action? Deleting this part that could never get hits?
There was a problem hiding this comment.
If you have identified dead code you can submit a follow up PR to remove
For string x values or multiindex, the axis locator is now set to a
FixedLocator for Line and Area plot. The ticklabel stay consistent
when scaling and zooming.
closes #7612
closes #15912
closes #22334
git diff upstream/master -u -- "*.py" | flake8 --diff