Plotting methods (line, area, ..) don't handle string x values #22334
Comments
|
I think I have found the place this is happening, or not happening. Bar and barh both work with the labels as above, but lineplot and areaplot (subclass of lineplot), both do not. For bar and barh the xtick labeling happens in ...
if self.use_index:
str_index = [pprint_thing(key) for key in data.index]
else:
str_index = [pprint_thing(key) for key in range(data.shape[0])]
name = self._get_index_name()
self._decorate_ticks(ax, name, str_index)
def _decorate_ticks(self, ax, name, ticklabels):
ax.set_xticks(self.tick_pos)
ax.set_xticklabels(ticklabels)
if name is not None and self.use_index:
ax.set_xlabel(name)I have it changed and working locally in the lineplot class when using the |
|
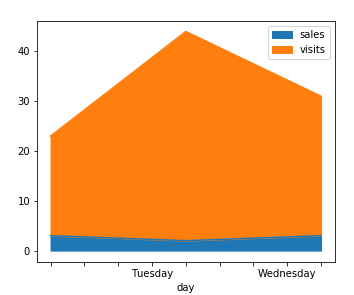
This seems to be partially fixed in 0.24.1 where the code from above gives
However, this just brings to light the real problem, namely that the ticks are essentially only at the correct position by coincidence. E.g. if you let the axes autoscale, the ticks are completely off.
In total this is the same issue as plotting with index of objects should use |

Ah, thanks for the link, that is probably the issue I was looking for.
Contributions are very welcome! |
|
This issue still persists! In my case, I'm seeing some |

|
I'm going to take a crack at this. If anyone else is trying as well let me know! |
|
Hey everyone I want to contribute my solution to this issue. Can I?? |
Sure, post how are you going to solve this issue. |
Separate the test for pandas-dev#7612 and pandas-dev#22334, that are about string index,
and test for pandas-dev#15912, about multiindex.
From #22307 (review): when specifying the x labels in one of our plotting calls where this consists of strings, nothing is shown on the x labels:
The same is true for line plot, for bar plot it does work.
Related to #18687 (but not exactly the same), and potentially #18726. I would have expected that there is already an issue for this, but didn't directly find it.
The text was updated successfully, but these errors were encountered: