Add scatterplot function #2861
Add scatterplot function #2861
Conversation
pymc3/plots/__init__.py
Outdated
| @@ -6,3 +6,4 @@ | |||
| from .traceplot import traceplot | |||
| from .energyplot import energyplot | |||
| from .densityplot import densityplot | |||
| from .scatterplot import scatterplot | |||
There was a problem hiding this comment.
Add carriage return at the end of the line
| traces['_'.join([v, str(i)])] = vi | ||
| else: | ||
| traces[v] = vals | ||
| return traces |
There was a problem hiding this comment.
Add carriage return at end of line
|
This looks quite nice. |
pymc3/plots/scatterplot.py
Outdated
| ax[j, 0].tick_params(labelsize=text_size) | ||
|
|
||
| plt.tight_layout() | ||
| return ax |
|
This looks really good. |
pymc3/plots/scatterplot.py
Outdated
|
|
||
| if varnames is None: | ||
| if plot_transformed: | ||
| trace_dict = get_trace_dict(trace, get_default_varnames(trace.varnames, True)) |
There was a problem hiding this comment.
I think it is better to plot only the free_RVs if plot_transformed=True, otherwise you will have a plot showing only the transformation (e.g., tau and tau_log__, which would essentially be redundant).
pymc3/plots/scatterplot.py
Outdated
| if np.any(divergent): | ||
| ax.scatter(trace_dict[varnames[0]][divergent == 1], trace_dict[varnames[1]][divergent == 1], **kwargs_divergence) | ||
| else: | ||
| print('No divergences were found.') |
There was a problem hiding this comment.
(this whole comment also applies to the similar block below)
could you remove this print statement?
I think this block might be nicer as just
try:
    divergent = trace['diverging']
except KeyError:
    warnings.warn(...)
    return ax
diverge = (divergent == 1)
ax.scatter(trace_dict[varnames[0]][diverge], trace_dict[varnames[1]][diverge], **kwargs_divergence)
The scatter should then just be empty if there are no divergences, which I think is fine (the other alternative would be something like putting text on the plot saying "there are no divergences found").
pymc3/plots/scatterplot.py
Outdated
| warnings.warn('There is no divergence information in the passed trace.') | ||
| return ax | ||
|
|
||
| if ax is None: |
There was a problem hiding this comment.
creating default axes should be above, right after defining numvars. Then you also would not have to special case numvars==2.
pymc3/plots/scatterplot.py
Outdated
| return ax | ||
|
|
||
| if ax is None: | ||
| _, ax = plt.subplots(nrows=numvars, ncols=numvars, figsize=figsize) |
There was a problem hiding this comment.
if you do nrows=numvars - 1, ncols=numvars - 1, then the two loops below would be
for i in range(numvars):
    for j in range(i + 1, numvars):
        ...
and you can remove the if i == j block
(this might be totally off base, if axes.remove() does not do what I think it does).
|
Looking at the example it seems you need to set Is there a way to optimized it? Since Also somewhat related is that, while I think using names like |
I agree, pairvarplot is ok. Maybe something shorter would be better, like pairplot |
|
I'm not keen on pairvarplot. Its not a tremendously clear name. I don't think the name collision is a big deal -- that's what namespaces are for. |
|
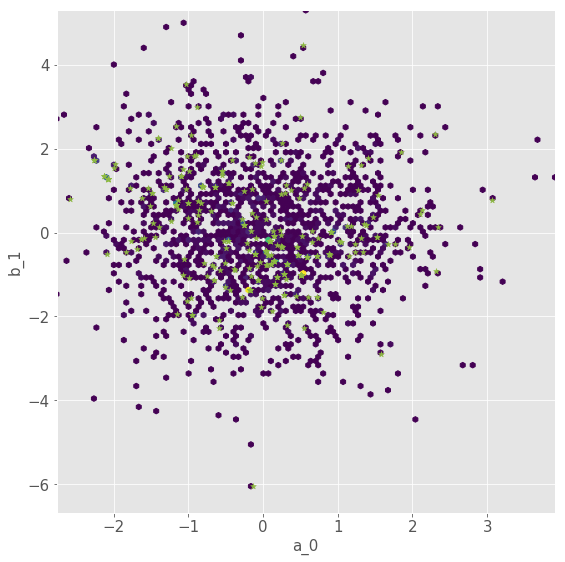
Thanks everyone for your insightful comments. I am taking every suggestion into account for my next commits. I think pairplot is a better suited name than scatterplot, because this function includes hexbin plot, which is not strictly a scatter plot. @ColCarroll Here are some examples: |

pymc3/plots/scatterplot.py
Outdated
|
|
||
| if divergences: | ||
| try: | ||
| divergent = trace['diverging'] |
There was a problem hiding this comment.
It would be cleaner to use trace.get_sampler_stats, just in case there is a var named 'diverging'.
pymc3/plots/scatterplot.py
Outdated
| if np.any(divergent): | ||
| ax[j, i].scatter(var1[divergent == 1], var2[divergent == 1], **kwargs_divergence) | ||
| else: | ||
| print('No divergences were found.') |
There was a problem hiding this comment.
no print. Do we even need to do anything here?
pymc3/plots/scatterplot.py
Outdated
| If True draws an hexbin plot | ||
| plot_transformed : bool | ||
| Flag for plotting automatically transformed variables in addition to | ||
| original variables (defaults to False). Applies when varnames/sub_varnames = None. |
pymc3/plots/scatterplot.py
Outdated
| try: | ||
| divergent = trace['diverging'] | ||
| if np.any(divergent): | ||
| ax[j, i].scatter(var1[divergent == 1], var2[divergent == 1], **kwargs_divergence) |
There was a problem hiding this comment.
You could use the actual position of the divergence here. They are buried in the warnings, see
https://github.com/pymc-devs/pymc3/blob/master/docs/source/notebooks/Diagnosing_biased_Inference_with_Divergences.ipynb
I don't want to expose this to users, but using it here seems fine.
ad4c616 to
be39d3d
Compare
141dc98 to
a60234d
Compare
|
Thanks you for your suggestions. I applied them in every case that was possible. |
|
Looks like you need to rebase. |
pymc3/plots/pairplot.py
Outdated
| @@ -0,0 +1,162 @@ | |||
| import warnings | |||
| import matplotlib.gridspec as gridspec | |||
There was a problem hiding this comment.
This line should be inside the try-except block below. Additionally you can change it to from matplotlib import gridspec
| Text size for labels | ||
| gs : Grid spec | ||
| Matplotlib Grid spec. | ||
| ax: axes |
There was a problem hiding this comment.
Passing ax and gs could be confusing, could we just use gs? I see the ax is there for the special case of plotting a two variable pairplot, but the same effect can be achieved using just gs, right?
| Returns | ||
| ------- | ||
|
|
||
| ax : matplotlib axes |
There was a problem hiding this comment.
The function should return a gridspec object
pymc3/plots/pairplot.py
Outdated
| ax : matplotlib axes | ||
|
|
||
| """ | ||
|
|
There was a problem hiding this comment.
Remove blank line, try running autopep8 to fix all this style issues.
|
LGTM! |
|
Thanks, @agustinaarroyuelo! |
|
Thanks for the contribution, Agustina! |
|
resolves #2745 |
This function allows to plot scatter matrices of the sampled parameters, or a subset of them. Additionally, it can display divergences. I updated the "Diagnosing biased Inference with Divergences" notebook with examples using this new feature. I am looking forward to receive feedback.