Closed
Description
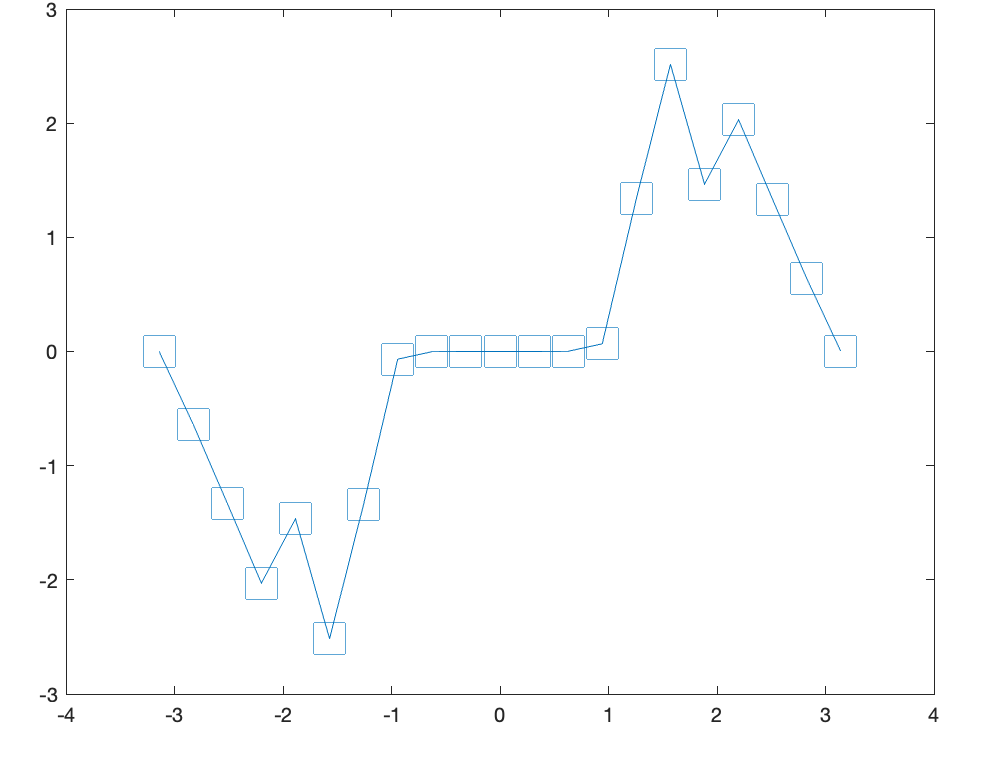
Code used to generate plots:
x = -pi:pi/10:pi;
y = tan(sin(x)) - sin(tan(x));
plot(x,y,'Marker','s', 'MarkerSize',20)
fig2plotly()
Expected and obtained plots

Metadata
Metadata
Assignees
Labels
No labels
Code used to generate plots:
x = -pi:pi/10:pi;
y = tan(sin(x)) - sin(tan(x));
plot(x,y,'Marker','s', 'MarkerSize',20)
fig2plotly()
Expected and obtained plots