Open
Description
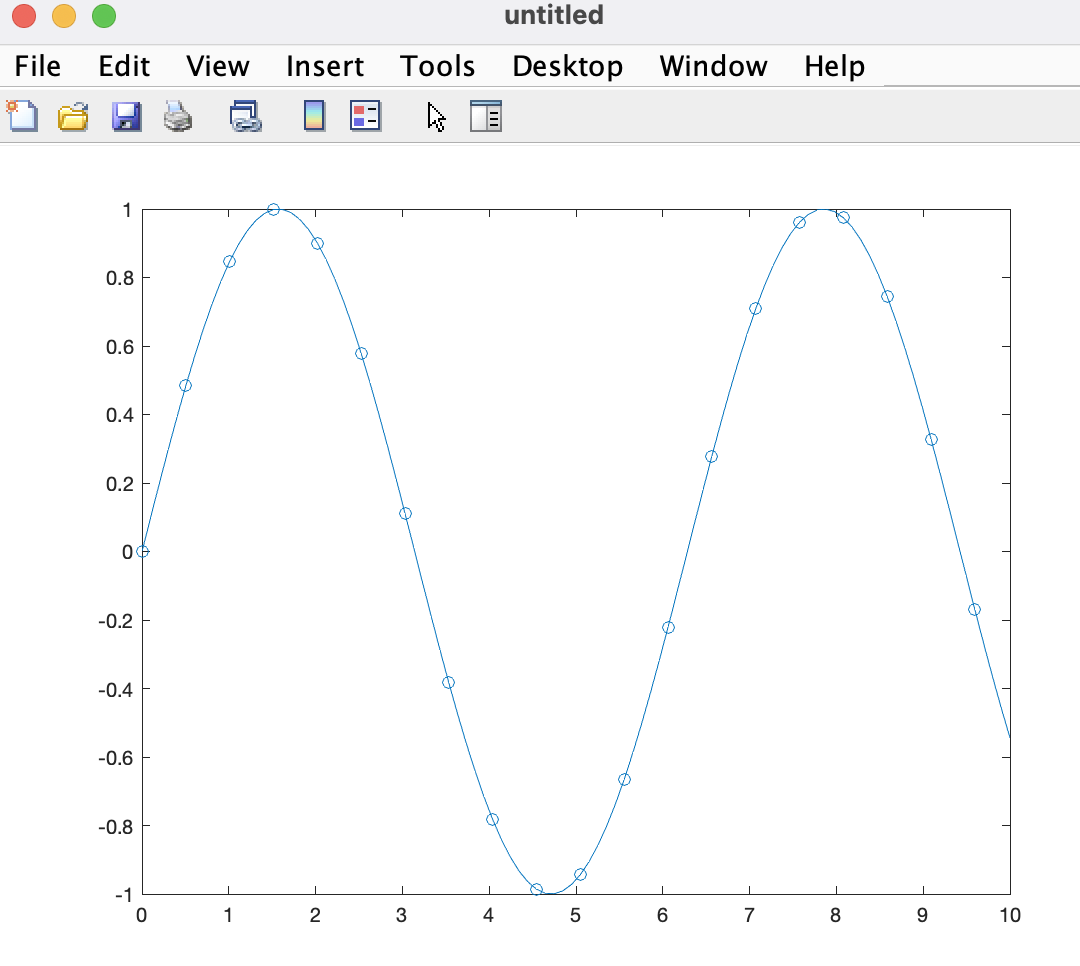
Code used to generate plots:
x = linspace(0,10);
y = sin(x);
plot(x,y,'-o','MarkerIndices',1:5:length(y))
fig2plotly()
Expected and obtained plots:

Code used to generate plots:
x = linspace(0,10);
y = sin(x);
plot(x,y,'-o','MarkerIndices',1:5:length(y))
fig2plotly()
Expected and obtained plots: