-
-
Notifications
You must be signed in to change notification settings - Fork 1.9k
Fix scatter and scattergl hover on axes with period and adjust the unified hover position in respect to mean #5836
New issue
Have a question about this project? Sign up for a free GitHub account to open an issue and contact its maintainers and the community.
By clicking “Sign up for GitHub”, you agree to our terms of service and privacy statement. We’ll occasionally send you account related emails.
Already on GitHub? Sign in to your account
Conversation
| @@ -51,23 +51,13 @@ function calc(gd, trace) { | |||
| calcAxisExpansion(gd, trace, xa, ya, x, y, ppad); | |||
| } | |||
|
|
|||
| var hasPeriodX = !!trace.xperiodalignment; | |||
There was a problem hiding this comment.
Choose a reason for hiding this comment
The reason will be displayed to describe this comment to others. Learn more.
interesting that this PR is mostly removals :)
There was a problem hiding this comment.
Choose a reason for hiding this comment
The reason will be displayed to describe this comment to others. Learn more.
Less is more :)
|
Playing with this a bit, I'm noticing that the y-position of the unified label feels a bit weird... I thought it was set to be at the median of all the points it contained, or something like that, no? |
No. That's based on the winning point at the moment. plotly.js/src/components/fx/hover.js Lines 1073 to 1076 in 990e260
However we could possibly use median of y values on x unified and median of x on y unified.If that's what you want please open a new issue for that. |
Is this something we changed in the v2 set of changes? I feel like I recall that when we first did this |
Positive: |
|
Now addressed in b44e11d |
|
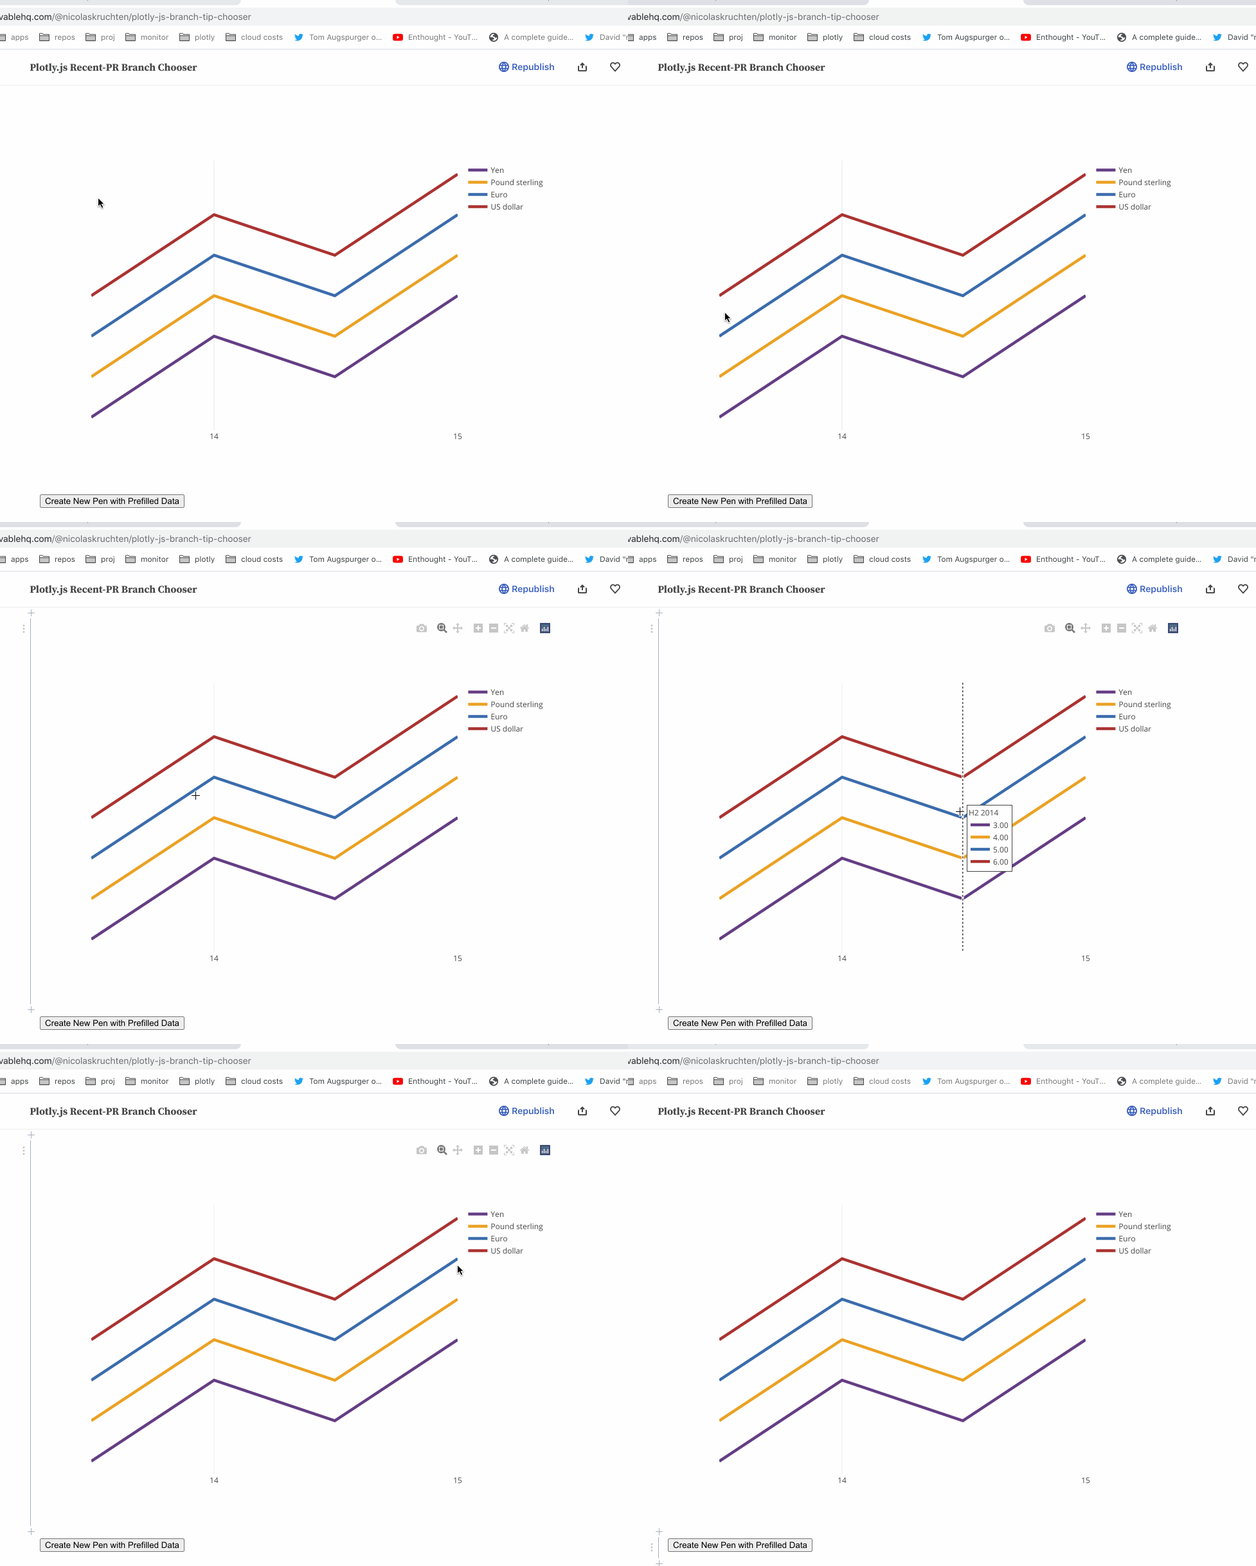
Ah, much nicer! For some reason the hover for the left-most seems higher with respect to the data than the others... is that normal? |
Look normal to me: demo |
|
Ok, we can fix that particular oddity later I guess :) |
|
Huh, this only happens in Observable, not in CodePen. Annoying! https://codepen.io/nicolaskruchten/pen/JjNJgxE But ✨ from me! |
| @@ -627,6 +627,9 @@ describe('hover with (x|y)period positioning', function() { | |||
|
|
|||
| it('@gl shows hover info for scattergl', function(done) { | |||
| Plotly.newPlot(gd, require('@mocks/gl2d_period_positioning.json')) | |||
| .then(function() { return Plotly.restyle(gd, 'xperiodalignment', 'start'); }) | |||
| .then(function() { return Plotly.restyle(gd, 'yperiodalignment', 'start'); }) | |||
There was a problem hiding this comment.
Choose a reason for hiding this comment
The reason will be displayed to describe this comment to others. Learn more.
Nonblocking, but these tests can be simplified (and sped up) with the object form
Plotly.restyle(gd,{xperiodalignment: 'start', yperiodalignment: 'start'})
There was a problem hiding this comment.
Choose a reason for hiding this comment
The reason will be displayed to describe this comment to others. Learn more.
Done in 17215eb
| @@ -2663,14 +2663,14 @@ describe('hover on traces with (x|y)period positioning', function() { | |||
| .then(function() { | |||
| assertHoverLabelContent({ | |||
| name: 'scatter', | |||
| nums: '(Jan 2001, 1)' | |||
| nums: '(Jul 2001, 1)' | |||
There was a problem hiding this comment.
Choose a reason for hiding this comment
The reason will be displayed to describe this comment to others. Learn more.
So these tests were actually locking down the incorrect behavior previously... This is why in general I think such tests should be self-contained rather than relying on a separate mock: you can read the test carefully and if the dimensions are nice and simple (ie you set round numbers for the size, margins, & axis ranges) you can manually verify that it's the desired behavior.
There was a problem hiding this comment.
Choose a reason for hiding this comment
The reason will be displayed to describe this comment to others. Learn more.
Excellent! Only non-blocking comments. 💃
scatter and scattergl hover on axes with period and adjust the unified hover position in respect to mean
scatter and scattergl hover on axes with period and adjust the unified hover position in respect to mean


Closes #5822.
@plotly/plotly_js