Add tips for writing selection tests #2567
Conversation
CONTRIBUTING.md
Outdated
| @@ -177,6 +177,32 @@ which shows the baseline image, the generated image, the diff and the json mocks | |||
|
|
|||
| To view the results of a run on CircleCI, download the `build/test_images/` and `build/test_images_diff/` artifacts into your local repo and then run `npm run start-image_viewer`. | |||
|
|
|||
| ### Writing selection tests | |||
There was a problem hiding this comment.
Thanks for doing this!
Your tips don't just apply to selection tests though. Hover and click tests also rely on these relative-top-left pixel coordinates. Maybe this section header could instead be Writing interaction tests?
CONTRIBUTING.md
Outdated
|
|
||
| ``` | ||
| Plotly.newPlot(gd, | ||
| [ |
There was a problem hiding this comment.
Although not a linting mistake, we prefer formatting blocks like this one like this:
Plotly.newPlot(gd, [{
    // ...
}], {
    // ...
});
CONTRIBUTING.md
Outdated
|
|
||
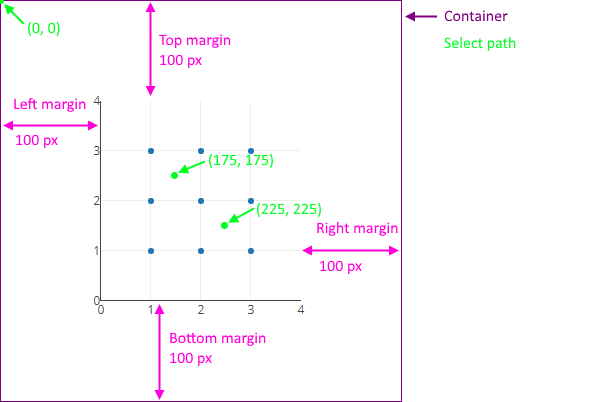
| This will produce the following plot, and you want to simulate a selection path of (175, 175) to (225, 225): | ||
|
|
||
| <img src="https://user-images.githubusercontent.com/31989842/38889542-5303cf9c-427f-11e8-93a2-16ce2e29f521.png"> |
|
Updated the diagram to make the point marked (0, 0) to be actually (0, 0) in the image, so that if you use a paint program to measure coordinates, it adds up:
(Plus a sneaky place to upload this) |
…nteraction tests"
CONTRIBUTING.md
Outdated
| margin: {l: 100, r: 100, t: 100, b: 100}, | ||
| xaxis: {range: [0, 4]}, | ||
| yaxis: {range: [0, 4]} | ||
| }); |
There was a problem hiding this comment.
Hmm. That's not quite right. Make sure there are 4 spaces before the keys and none before the }], { and ]); lines.
|
Beautifully done. Thank you very much! |
Follow-up from the discussion in PR #2506, add documentation to help orient developers in the selection coordinate system.