ENH/VIS: Plotting DataFrame/Series with matplotlib.table #6661
Conversation
|
@TomAugspurger pls have a look at this when you get a chance |
|
pls add the release note to v0.14.0 as well |
|
@sinhrks can you rebase this? |
|
also, can you add an example in plotting.rst using this? |
| @@ -2590,6 +2603,51 @@ def _grouped_plot_by_column(plotf, data, columns=None, by=None, | |||
| return fig, axes | |||
|
|
|||
|
|
|||
| def table(ax, data, transpose=False, rowLabels=None, colLabels=None, | |||
There was a problem hiding this comment.
Could we get rid of the transpose argument? It's probably easier for people to do table(ax, data.T) rather than table(ax, data, transpose=True). Fewer arguments too. That should also go along better with the rowLabels and colLabels arguments. If we have transpose=True and rowLabels=None is it the index of the original data or the transposed data? If we get rid of transpose then they pass data.T it's clear what rowLabels refers to.
There was a problem hiding this comment.
Also change rowLables -> row_labels and colLabels -> col_labels for PEP8 style
There was a problem hiding this comment.
Yes, transpose can be removed. It was for draw horizontal table by series which doesn't have transpose little easily, but it can be done once casted to DataFrame.
rowLabels and colLabels are derived from matplotlib. Thus I think it shouldn't be changed. I'll modify the comment to indicate that these are mpl keywords.
|
When you put the example in I don't think that we should do much try to automatically format the tables well. I'm guessing this is something that doesn't have a great general solution. |
|
Let me know when you get those changes and rebased and I'll merge. Thanks and sorry for missing this when you submitted the PR. |
|
@TomAugspurger Thanks for your review and comments. I've added examples to |
ENH/VIS: Plotting DataFrame/Series with matplotlib.table
|
Agreed about sticking with the MPL keywords. Good call. Thanks @sinhrks! |
|
hmm....the first example in the docs is not printing the table http://pandas-docs.github.io/pandas-docs-travis/visualization.html#plotting-with-table |
|
It actually may be a figsize thing. It looks like it is plotting the table but it gets cut off. |
|
I'm looking into this btw. |
|
@TomAugspurger when you update can you add a link in v0.14.0 to the docs for table plotting? thanks |
|
I'm not able to reproduce this locally, so I haven't found out what's causing the problem. The good news is that it's not mol 1.1.1 related. I was unable to reproduce it with that also. These are built by travis right? So there's no way to get access to the machine as its building? |
|
I think you could in your branch push something up with the flag to turn doc builds on and the n have it dump whatever output you need (e.g. just use print statements) |
closes #4803
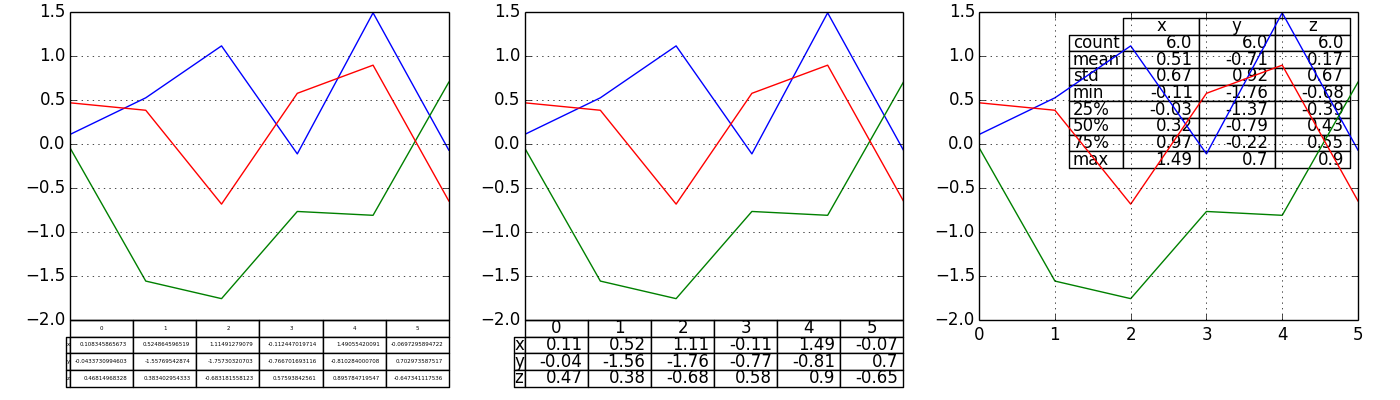
Related to #4803, I prepared some codes to add a
matplotlib.TabletoDataFrameandSeriesplot usingtablekeyword.tablecan take followings as an input:False: Do nothing (default).True: Draw a table using the data calledplotmethod. Data will be transposed to meet the matplotlib's default layout.DataFrameorSeries: Draw matplotlib.table using the passed data. The data will be drawn as displayed in print method (not transposed automatically).Also, helper function
pandas.tools.plotting.tableis added to create a table fromDataFrameandSeries, and add it to thematplotlib.Axes.Example:
Outputs: