ENH/VIS: Area plot is now supported by kind='area'. #6656
Conversation
|
|
||
| def _get_plot_function(self): | ||
| if self.logy or self.loglog: | ||
| raise ValueError("Log-scales are not supported in area plot") |
There was a problem hiding this comment.
Log-x scales are supported right? You could change this to "Log-y scales are not supported in area plot".
When I try a logx=True I get a segfault actually (on the matplotlib side).
There was a problem hiding this comment.
Modified the error message. logx=True should work, and I've added a test case.
|
You can put an example in One thing case that your implementation doesn't allow is stacked with mixed positive and negatives, where every value in a column are either all positive or all negative. I think this would make sense visually. We can leave that for a future issue if you want. |
|
Thanks. I've added examples in |
| Area plot | ||
| ~~~~~~~~~~~~~~~~~~~ | ||
|
|
||
| *New in .14* You can create area plots with ``Series.plot`` and ``DataFrame.plot`` by passing ``kind='area'``. Area plots are stacked by default. To produce stacked area plot, all the dataframe values are either positive or negative. |
There was a problem hiding this comment.
Can you change the New in .14 to .. versionadded:: 0.14 on a seperate line?
|
Sure. Done it. There are other version descriptions which uses italic in 455, 468, 487th lines. Shall I modify it as the same manner? |
| ~~~~~~~~~~~~~~~~~~~ | ||
|
|
||
| .. versionadded:: 0.14 | ||
| You can create area plots with ``Series.plot`` and ``DataFrame.plot`` by passing ``kind='area'``. Area plots are stacked by default. To produce stacked area plot, all the dataframe values are either positive or negative. |
There was a problem hiding this comment.
Small detail, there also has to be a blank line here between versionadded and the necxt paragraph
|
Failed in |
|
@sinhrks can you rebase @TomAugspurger @jorisvandenbossche ok with this? |
|
Rebased. Could you check #6678 first, because I'll apply the same fix to area plot. |
| @@ -1933,6 +2036,8 @@ def plot_frame(frame=None, x=None, y=None, subplots=False, sharex=True, | |||
| klass = ScatterPlot | |||
| elif kind == 'hexbin': | |||
| klass = HexBinPlot | |||
| elif kind == 'area': | |||
There was a problem hiding this comment.
Could you add 'area' to the set of valid values for kind in the docstring for plot_frame and plot_series?
|
The way you've done it makes gives some strange results if someone does multiple area plots on the same axis (I can't think of a reason why anyone would want to do this, but who knows). In [64]: df
Out[64]:
0 1 2
0 0 1 3
1 1 2 7
2 1 6 8
3 5 10 8
4 5 11 8
5 9 15 11
6 9 19 15
7 12 20 17
8 15 20 19
9 16 25 20
10 17 27 21
11 21 30 25
12 21 30 28
13 25 31 30
14 25 32 34
15 28 34 35
16 29 38 38
17 30 38 42
18 34 38 44
19 38 38 48
[20 rows x 3 columns]
In [65]: df2 = df + 10
In [66]: ax = df.plot(kind='area')
In [67]: df2.plot(kind='area', ax=ax)
Out[67]: <matplotlib.axes.AxesSubplot at 0x10f603250>The original shading is removed: Honestly, I think I'm OK with this. Unless someone can think of any reason where multiple, independently stacked datasets on the same axes makes sense. |

| @@ -150,6 +150,7 @@ API Changes | |||
|
|
|||
| - ``DataFrame.sort`` now places NaNs at the beginning or end of the sort according to the ``na_position`` parameter. (:issue:`3917`) | |||
|
|
|||
| <<<<<<< HEAD | |||
There was a problem hiding this comment.
Merge errer here. You can remove while rebasing.
|
That's all my comments. The biggest one is deciding how to handle NaNs. Thoughts? |
|
Thanks for all your comments. Multiple area plots on single axes:Actually it is not deleted. When If you pass
Handling NaN:It looks MPL
|


|
Also, I noticed that initial description was incorrect. Each line/area can be stacked on positive/negative direction separately if each columns are all either positive or negative. No need to all the data is either positive or negative. I've changed the logic, and will add some tests/docs for this.
|

|
I've added tests for fixed
|
|
|
||
| .. versionadded:: 0.14 | ||
|
|
||
| You can create area plots with ``Series.plot`` and ``DataFrame.plot`` by passing ``kind='area'``. Area plots are stacked by default. To produce stacked area plot, each columns must be either all positive or negative values. |
There was a problem hiding this comment.
typo: columns -> column. Also maybe change "must be either" to "must have either" and "all positive or negative" to "all positive or all negative"
|
I think a default alpha of 1 when stacked and .5 when not stacked is good. Your Good catch on the all positive / all negative checks by column. I'm reviewing now. Should be able to merge this today. |
| .. ipython:: python | ||
|
|
||
| @savefig area_plot_unstacked.png | ||
| df.plot(kind='area', stacked=False); |
There was a problem hiding this comment.
Could you make a note here that NaNs are filled to zero by default, and that if you don't want that you should fill or drop the NaNs before plotting. (No need for an example with nans)
| @@ -1256,6 +1406,14 @@ def test_partially_invalid_plot_data(self): | |||
| with tm.assertRaises(TypeError): | |||
| df.plot(kind=kind) | |||
|
|
|||
| # area plot doesn't support positive/negative mixed data | |||
| kinds = ['area'] | |||
| df = DataFrame(rand(10, 2), dtype=object) | |||
There was a problem hiding this comment.
Same thing here with using a seed known to produce a mixed frame.
|
@sinhrks ping me when you rebase. |
…rea plot can be stacked by stacked=True.
|
Looks like there was a Yahoo failure, I restarted the build. |
|
this is fine, I already fixed master |
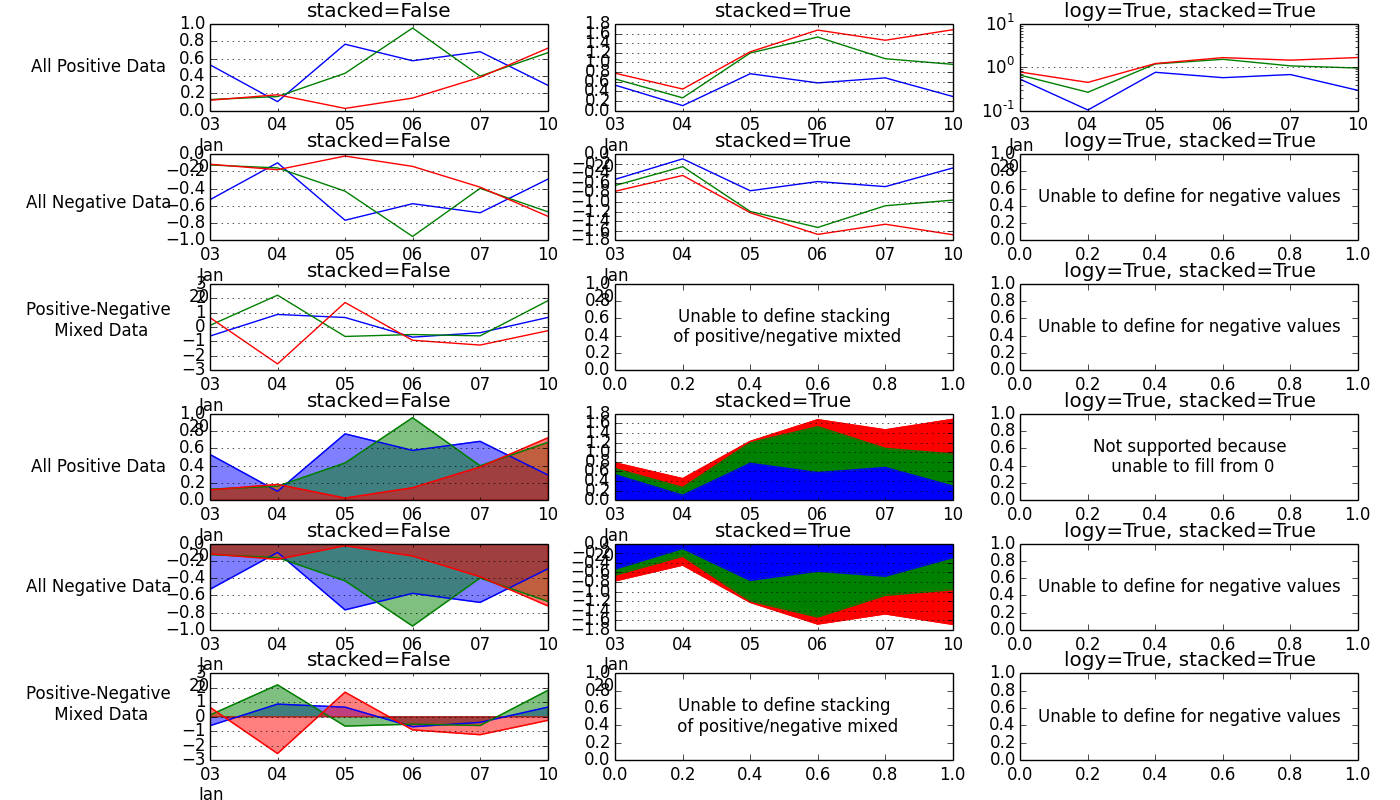
ENH/VIS: Area plot is now supported by kind='area'.
Area plot is added to plotting method. The AreaPlot class is created as a subclass of LinePlot, thus it works also in time series.
By default, area plot is being stacked. When area plot is not stacked (
stacked=False), alpha value is set to 0.5 to show overlapped area if not configured specifically. As a side benefit, line plot also can be stacked by specifyingstacked=True(disabled by default). Different from stacked bar plot, I don't know good visualization for positive/negative mixed data. Thus, input must be all positive or all negative whenstacked=True. I'll try to implement it if there is a good way. Also, area plot doesn't support logy and loglog plot because filling area starts from 0.Note: Area plot's legend is implemented based on the answer described in:
http://stackoverflow.com/questions/14534130/legend-not-showing-up-in-matplotlib-stacked-area-plot
Example: