DOC: update pandas.DataFrame.boxplot docstring. Fixes #8847 #20152
Conversation
pandas/plotting/_core.py
Outdated
|
|
||
| Parameters | ||
| ---------- | ||
| data : the pandas object holding the data | ||
| column : column name or list of names, or vector |
There was a problem hiding this comment.
The Parameter types do not follow the docstring guide.
For example, I suggest that column should be something like:
column : str or list of str, optional
    Column name or list of names, or vector. Can be any valid input to groupby.
An it applies to the other params as well.
There was a problem hiding this comment.
Thanks for the suggestion!
| @@ -1935,52 +1935,134 @@ def plot_series(data, kind='line', ax=None, # Series unique | |||
|
|
|||
|
|
|||
| _shared_docs['boxplot'] = """ | |||
| Make a box plot from DataFrame column optionally grouped by some columns or | |||
There was a problem hiding this comment.
The first line should be a short summary not including any details. See https://python-sprints.github.io/pandas/guide/pandas_docstring.html#section-1-short-summary.
pandas/plotting/_core.py
Outdated
| @@ -1935,52 +1935,134 @@ def plot_series(data, kind='line', ax=None, # Series unique | |||
|
|
|||
|
|
|||
| _shared_docs['boxplot'] = """ | |||
| Make a box plot from DataFrame column optionally grouped by some columns or | |||
| other inputs | |||
| Make a box-and-whisker plot from DataFrame column optionally grouped | |||
There was a problem hiding this comment.
Perhaps you are focusing too much on the shape of a boxplot and how to interpret it. According to the guide:
The extended summary should provide details on why the function is useful and their use cases, if it is not too generic
So I believe it would be better to put more focus on this.
There was a problem hiding this comment.
Sorry, now I read #8447 and I see we wanted to add more context about the components of a boxplot and what they mean. So it's OK to leave this.
Maybe add something about the use case for this graph:
A box plot shows the distribution of data with respect to a given variable.
Before the explanatin of the figure.
pandas/plotting/_core.py
Outdated
| quartile values of the data, with a line at the median (Q2). | ||
| The whiskers extend from the edges of box to show the range of the data. | ||
| Flier points (outliers) are those past the end of the whiskers. | ||
| The position of the whiskers is set by default to 1.5 IQR (`whis=1.5``) |
There was a problem hiding this comment.
"`whis=1.5``" is not formatted correctly, you should have double backquotes also at the start.
Anyhow I think the meaning of whis and its default should be explained in the Parameters section.
There was a problem hiding this comment.
ok, I will leave it because it is not defined in the pandas function, but as a matplotlib parameter.
There was a problem hiding this comment.
OK, then as you say it's probably not good to write about this parameter here, since it will be confusing for the reader.
pandas/plotting/_core.py
Outdated
|
|
||
| Parameters | ||
| ---------- | ||
| data : the pandas object holding the data |
There was a problem hiding this comment.
You are probably right about removing this argument, because even if it's present in the original function, this function is never used alone, but always inside a Series of DataFrame, where data is self
There was a problem hiding this comment.
ok, we thought the same, that it is always called from a pandas' object instantiating matplotlib. We checked with other functions (like pandas.plot.line) and data it is not included as parameter in the documentation. Maybe this explains why the validation test failed.
There was a problem hiding this comment.
No problem, the validation script is a linter, but we humans are more intelligent than linters and know when to not take into account their output. :)
pandas/plotting/_core.py
Outdated
| Column in the DataFrame to group by | ||
| ax : Matplotlib axes object, optional | ||
| Column in the DataFrame to groupby. | ||
| ax : Matplotlib axes object, (default `None`) |
There was a problem hiding this comment.
According to the guide, you should not use parenthesis around default values. Use Matplotlib axes object, default None. Also it would be nice to explain what None means here - create a new plot.
There was a problem hiding this comment.
I think it'd be better that the type is the Python type (meaning matplotlib.pyplot.axis if that's the right one).
There was a problem hiding this comment.
It's the axes returned by gca, matplotlib.axes.Axes.
There was a problem hiding this comment.
It comes from matplotlib.figure.Figure.gca(), so probably matplotlib.axes.Axes, right?
pandas/plotting/_core.py
Outdated
| >>> np.random.seed(1234) | ||
|
|
||
| >>> df = pd.DataFrame({ | ||
| ... u'stratifying_var': np.random.uniform(0, 100, 20), |
There was a problem hiding this comment.
The docs guide advises to try avoid using random data. In this case I believe it's justifiable because there is a relation between random distributions and boxplots and this can be shown in examples.
However please explain in plain English that you are creating a dataframe with points following a uniform and a normal distribution, respectively, in the different columns. You can also probably find two variables that are naturally uniform and normal, respectively.
There was a problem hiding this comment.
@lkxz See this ^^ . @datapythonista what do you think? Is it OK to use random data with a seed sometimes in examples if it makes sense?
There was a problem hiding this comment.
I agree, feel free to update the documentation too.
There was a problem hiding this comment.
BTW do we want to use the unicode mark u'' at all in documentation examples? I believe we should always write strings without u or b unless necessary. This way it will be a bytestring in Python 2 and a text (unicode) in Python 3.
pandas/plotting/_core.py
Outdated
| ... u'price': np.random.normal(100, 5, 20), | ||
| ... u'demand': np.random.normal(100, 10, 20)}) | ||
|
|
||
| >>> df[u'quartiles'] = pd.qcut( |
There was a problem hiding this comment.
I believe this is making the example more complicated than needed. The user needs to understand what the qcut method does to understand this example. Can you change the example to not use this additional function?
pandas/plotting/_core.py
Outdated
| 18 77.282662 100.623565 103.540203 50-75%% | ||
| 19 88.264119 98.386026 99.644870 75-100%% | ||
|
|
||
| To plot the boxplot of the ``demand`` just put: |
There was a problem hiding this comment.
- Better
create a boxplot. Repeatingplothere is a bit redundant withboxplot. :) - Avoid words as
just,simply, etc. - Here you are creating a boxplot of a column grouped by another one. Probably you want to create a boxplot without any grouping first to show the basic functionality.
There was a problem hiding this comment.
We found the example in the pandas' cookbook. We also thought it was complicated. Found another example easier in pandas' visualization guide. We're working on changing it.
There was a problem hiding this comment.
Yep, perhaps boxplot = df.boxplot(column='demand') is good enough.
pandas/plotting/_core.py
Outdated
|
|
||
| >>> boxplot = df.boxplot(column=u'demand', by=u'quartiles') | ||
|
|
||
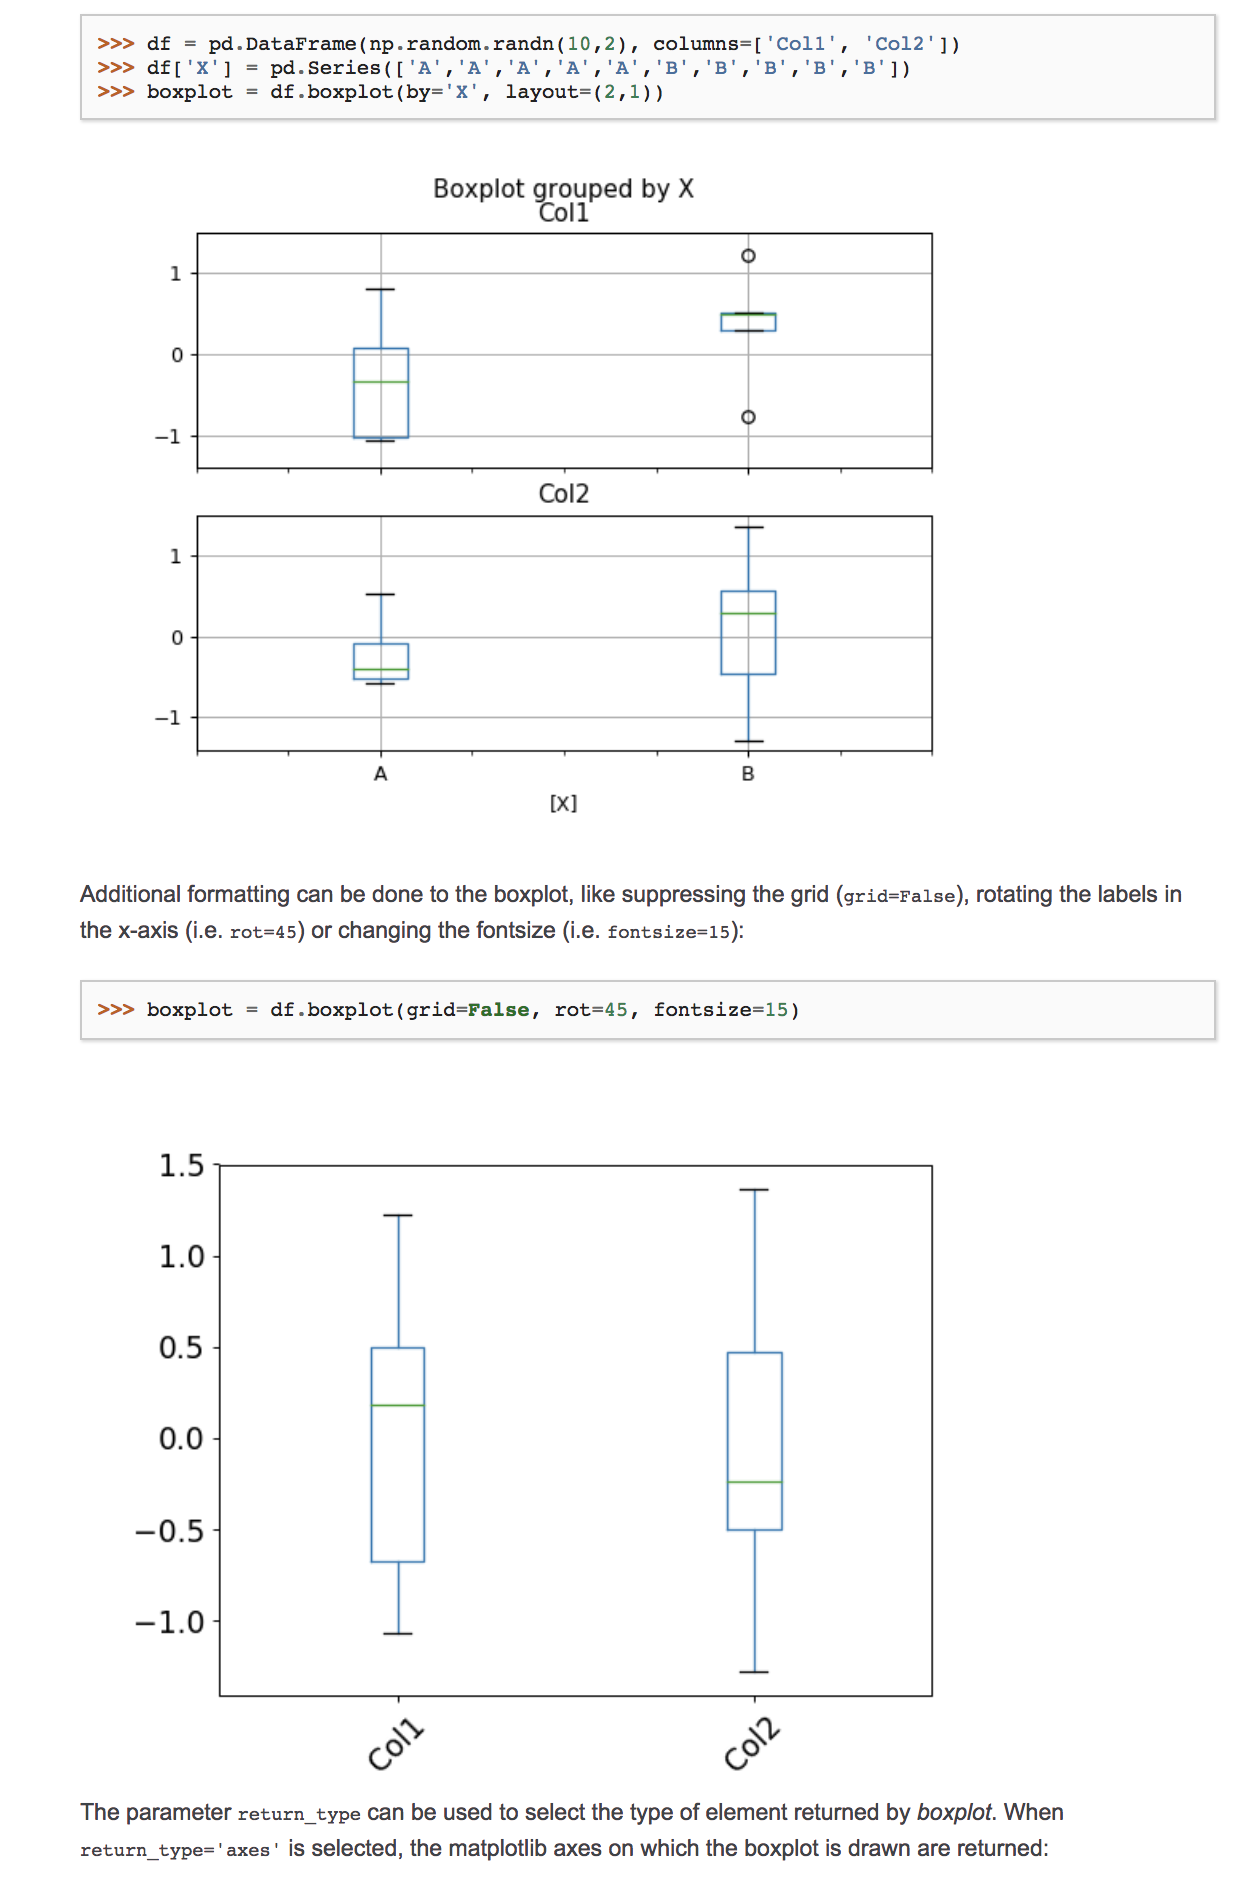
| Use ``grid=False`` to hide the grid: |
There was a problem hiding this comment.
Just changing this argument doesn't look like a lot of changes to justify an example. Perhaps we can change multiple parameters at the same time to show a more interesting example.
pandas/plotting/_core.py
Outdated
|
|
||
| >>> boxplot = df.boxplot(column=u'demand', by=u'quartiles', grid=False) | ||
|
|
||
| Optionally, the layout can be changed by setting ``layout=(rows, cols)``: |
There was a problem hiding this comment.
Yep but here you are playing with figsize as well, it's better if we mention that.
pandas/plotting/_core.py
Outdated
|
|
||
| See Also | ||
| -------- | ||
| matplotlib.pyplot.boxplot: Make a box and whisker plot. |
There was a problem hiding this comment.
I think hist is a good candidate to be listed here. As they somehow represent the same.
pandas/plotting/_core.py
Outdated
| >>> df | ||
| stratifying_var price demand quartiles | ||
| 0 19.151945 106.605791 108.416747 0-25%% | ||
| 1 62.210877 92.265472 123.909605 50-75%% |
There was a problem hiding this comment.
Does it make sense to use df.head() and avoid having this long output? Or is it relevant?
There was a problem hiding this comment.
I agree this is probably too long.
There was a problem hiding this comment.
Removed it in the new version.
pandas/plotting/_core.py
Outdated
| @@ -1935,52 +1935,134 @@ def plot_series(data, kind='line', ax=None, # Series unique | |||
|
|
|||
|
|
|||
| _shared_docs['boxplot'] = """ | |||
| Make a box plot from DataFrame column optionally grouped by some columns or | |||
| other inputs | |||
| Make a box-and-whisker plot from DataFrame column optionally grouped | |||
There was a problem hiding this comment.
I think the one liner summary is missing, isn't it?
There was a problem hiding this comment.
Already added it to the next commit.
pandas/plotting/_core.py
Outdated
| column : column name or list of names, or vector | ||
| Can be any valid input to groupby | ||
| Can be any valid input to groupby. | ||
| by : string or sequence |
There was a problem hiding this comment.
should be str instead of string. Also, I think we usually use array-like instead of sequence. I guess they mean the same in this case.
pandas/plotting/_core.py
Outdated
| Column in the DataFrame to group by | ||
| ax : Matplotlib axes object, optional | ||
| Column in the DataFrame to groupby. | ||
| ax : Matplotlib axes object, (default `None`) |
There was a problem hiding this comment.
I think it'd be better that the type is the Python type (meaning matplotlib.pyplot.axis if that's the right one).
pandas/plotting/_core.py
Outdated
| ax : Matplotlib axes object, optional | ||
| Column in the DataFrame to groupby. | ||
| ax : Matplotlib axes object, (default `None`) | ||
| The matplotlib axes to be used by boxplot. | ||
| fontsize : int or string |
Codecov Report
@@            Coverage Diff             @@
##           master   #20152      +/-   ##
==========================================
+ Coverage   91.82%   91.84%   +0.02%
==========================================
  Files         152      152
  Lines       49255    49255
==========================================
+ Hits        45226    45240      +14
+ Misses       4029     4015      -14
Continue to review full report at Codecov.
|

|
Updated the documentation and the first comment of the PR with the new screenshots and output of the validation test. |
pandas/plotting/_core.py
Outdated
| All other plotting keyword arguments to be passed to | ||
| matplotlib's boxplot function | ||
| `matplotlib.pyplot.boxplot <https://matplotlib.org/api/_as_gen/ |
There was a problem hiding this comment.
You can use :func:`matplotlib.pyplot.boxplot` instead of the full link
pandas/plotting/_core.py
Outdated
| rot : label rotation angle | ||
| column : str or list of str, optional | ||
| Column name or list of names, or vector. | ||
| Can be any valid input to groupby. |
There was a problem hiding this comment.
Is this related to groupby? I think it selects which columns to plot?
There was a problem hiding this comment.
Yest, the function _grouped_plot_by_column plots the columns performing a groupby.
There was a problem hiding this comment.
Added :meth:pandas.DataFrame.groupby.
pandas/plotting/_core.py
Outdated
| Column name or list of names, or vector. | ||
| Can be any valid input to groupby. | ||
| by : str or array-like | ||
| Column in the DataFrame to groupby. |
There was a problem hiding this comment.
Can you say something about what the effect is for the plot?
pandas/plotting/_core.py
Outdated
| Can be any valid input to groupby. | ||
| by : str or array-like | ||
| Column in the DataFrame to groupby. | ||
| ax : object of class matplotlib.axes.Axes, default `None` |
There was a problem hiding this comment.
keeping it as optional is fine. In the explanation below, I would add that if not passed, a new instance is created.
There was a problem hiding this comment.
Ok, thought the same. Will add it.
pandas/plotting/_core.py
Outdated
| Tick label font size in points or as a string (e.g., ‘large’) | ||
| (see `matplotlib.axes.Axes.tick_params | ||
| <https://matplotlib.org/api/_as_gen/ | ||
| matplotlib.axes.Axes.tick_params.html>`_). |
There was a problem hiding this comment.
I don't see more information about fontsize on that page?
pandas/plotting/_core.py
Outdated
| column : str or list of str, optional | ||
| Column name or list of names, or vector. | ||
| Can be any valid input to groupby. | ||
| by : str or array-like |
pandas/plotting/_core.py
Outdated
| rot : int or float, default 0 | ||
| The rotation angle of labels (in degrees) | ||
| with respect to the screen coordinate sytem. | ||
| grid : boolean, default `True` |
There was a problem hiding this comment.
It's not needed to use backticks in the type description
pandas/plotting/_core.py
Outdated
|
|
||
| `**kwds` : Keyword Arguments | ||
| The size of the figure to create in matplotlib. | ||
| layout : tuple (rows, columns) (optional) |
There was a problem hiding this comment.
(optional) -> , optional
There was a problem hiding this comment.
Had the doubt how to format it. Changed all to just optional.
pandas/plotting/_core.py
Outdated
| ``return_type`` is returned (i.e. | ||
| ``df.boxplot(column=['Col1','Col2'], by='var',return_type='axes')`` | ||
| may return ``Series([AxesSubplot(..),AxesSubplot(..)], | ||
| index=['Col1','Col2'])``). |
There was a problem hiding this comment.
I would rather add an example in the "Examples" section. As putting it here inline will always be limited
pandas/plotting/_core.py
Outdated
| :context: close-figs | ||
|
|
||
| >>> df = pd.DataFrame(np.random.rand(10,3), | ||
| ... columns=['Col1', 'Col2', 'Col3']) |
There was a problem hiding this comment.
You can re-use the df from the previous code-block, so maybe not needed to re-define here again
There was a problem hiding this comment.
I can remove all and use just the first dataframe, but wouldn't it be clearer to define a new dataframe in each code-block so the user has a clear image of the structure and can reproduce the example just by copy-pasting it, without having to look for the origin of the dataframe?
There was a problem hiding this comment.
I guess it depends, because also it can help to see plots of the exact same data with different variations, to see how the different arguments affect the output plot. Also, reusing the same dataframe can help making the examples section a bit shorter and less verbose.
Your call :)
pandas/plotting/_core.py
Outdated
|
|
||
| See Also | ||
| -------- | ||
| matplotlib.pyplot.boxplot: Make a box and whisker plot. |
There was a problem hiding this comment.
I think we need to put a space before the colons here as well.
pandas/plotting/_core.py
Outdated
| See Also | ||
| -------- | ||
| matplotlib.pyplot.boxplot: Make a box and whisker plot. | ||
| matplotlib.pyplot.hist: Make a hsitogram. |
pandas/plotting/_core.py
Outdated
| .. plot:: | ||
| :context: close-figs | ||
|
|
||
| >>> df = pd.DataFrame(np.random.rand(10,3), |
There was a problem hiding this comment.
As @jorisvandenbossche comments in #20373 (comment), I agree it's better to draw from a normal distribution here to get more natural boxplots.
pandas/plotting/_core.py
Outdated
| >>> df['X'] = pd.Series(['A','A','A','A','A','B','B','B','B','B']) | ||
| >>> boxplot = df.boxplot(by='X') | ||
|
|
||
| A list of strings (i.e. ``['X','Y']``) containing can be passed to boxplot |
There was a problem hiding this comment.
This sentence doesn't sound correct, it's missing some noun at "a list of strings containing (what?) can be passed to boxplot".
pandas/plotting/_core.py
Outdated
| ... columns=['Col1', 'Col2', 'Col3', 'Col4']) | ||
| >>> boxplot = df.boxplot(column=['Col1', 'Col2', 'Col3']) | ||
|
|
||
| Boxplots of variables distributions grouped by a third variable values |
There was a problem hiding this comment.
"grouped by the values of a third variable" sounds more natual to me, but I'm not a native English speaker.
|
@mabelvj can you go over the comments in the review? There are some of them that need to be addressed before we can merge this. |
|
Yes, I was reviewing them all before making a commit. Had some doubts with the examples for |
|
You accidentally added some binary files to your last commit. |
pandas/plotting/_core.py
Outdated
| @@ -2078,27 +2067,27 @@ def plot_series(data, kind='line', ax=None, # Series unique | |||
| :context: close-figs | |||
|
|
|||
| >>> np.random.seed(1234) | |||
| >>> df = pd.DataFrame(np.random.rand(10,4), | |||
| >>> df = pd.DataFrame(np.random.randn(10,4), | |||
There was a problem hiding this comment.
flake8 will demand a space after the comma, so np.random.randn(10, 4)
There was a problem hiding this comment.
It accepts it, no error popped out!
11105ac to
7daedd4
Compare
pandas/plotting/_core.py
Outdated
| returned by `boxplot`. When ``return_type='axes'`` is selected, | ||
| the matplotlib axes on which the boxplot is drawn are returned: | ||
|
|
||
| >>> df.boxplot(column=['Col1','Col2'], return_type='axes') |
There was a problem hiding this comment.
IMHO it might be enough with a couple of examples for the return types, perhaps being so exhaustive is too verbose and a bit overkill, since one has to care about the ellipsis and all... The different possibilities are already explained at the parameters section.
There was a problem hiding this comment.
OK. I'll keep just the most complicated case that needed explanation from the parameters definition.
There was a problem hiding this comment.
FYI, you can do axes = df.boxplot(...). Then the return isn't printed out and the test will pass.
There was a problem hiding this comment.
If you want to make a point about the return type, you can do
>>> result = df.boxplot(...)
>>> type(result)
<class pandas.Series>
or something like that.
There was a problem hiding this comment.
Great tip! Didn't know how to do it. The internal structure is not shown but it's enough. Thanks @TomAugspurger!
8bb9d4d to
e9476fc
Compare
|
Just to verify, the validate_docstring script passes with your latest (aside from |
pandas/plotting/_core.py
Outdated
| lines : dict | ||
| ax : matplotlib Axes | ||
| (ax, lines): namedtuple | ||
| result: |
There was a problem hiding this comment.
This is the one section I'm unsure about. I would maybe reformat it as
keyord : type
so
The return type depends on the `return_type` parameter

* 'axes': a matplotlib.axes.Axes
* 'dict' : a dictionary of ...
* 'both': namedtuple of ...

When grouping the data by `by`, a Series of `return_type` is returned.
And then whatever is going on with return_type=None and by. Sorry this is such a mess, I think it's my fault :)
There was a problem hiding this comment.
What about this?:
    result: type

        The return type depends on the `return_type` parameter:

        * 'axes' : object of class matplotlib.axes.Axes
        * 'dict' : dict of matplotlib.lines.Line2D objects
        * 'both': a nametuple with strucure (ax, lines)

        For data grouped with ``by``:

        * :class:`~pandas.Series`
        * :class:`~numpy.array` (for ``return_type = None``)
There was a problem hiding this comment.
LGTM! However I wouldn't write the "type" part after result :, since it doesn't add anything in this case, everything is explained later.
pandas/plotting/_core.py
Outdated
| other inputs | ||
| Make a box plot from DataFrame columns. | ||
|
|
||
| Make a box-and-whisker plot from DataFrame columns optionally grouped |
There was a problem hiding this comment.
May be a comma after "columns"?
There was a problem hiding this comment.
But the first line should be like a short description and then a whole paragraph going into detail, or not?
There was a problem hiding this comment.
Yes, the comma not in the short summary instead of the period. The comma in the whole paragraph Make a box-and-whisker plot from DataFrame columns, optionally grouped :)
There was a problem hiding this comment.
Great! I'll add that.
pandas/plotting/_core.py
Outdated
| The box extends from the Q1 to Q3 quartile values of the data, | ||
| with a line at the median (Q2).The whiskers extend from the edges | ||
| of box to show the range of the data. The position of the whiskers | ||
| is set by default to 1.5*IQR (IQR = Q3 - Q1) from the edges of the box. |
There was a problem hiding this comment.
I'd use backticks for the formula, and use spaces as in Python, so `1.5 * IQR (IQR = Q3 - Q1)`. I think the render in html should look more clear.
There was a problem hiding this comment.
Backticks as code or cursive?
There was a problem hiding this comment.
Good point, not sure if it's code. It's your call, I think having a different format from the rest would help understand. May be ``IQR * 1.5`` where ``IQR = Q3 - Q1``? ;) That seems like kind of Python propoer code. :)
But whatever you like, it was just an idea that I think would make it a bit easier to read.
pandas/plotting/_core.py
Outdated
| by some other columns. A box plot is a method for graphically depicting | ||
| groups of numerical data through their quartiles. | ||
| The box extends from the Q1 to Q3 quartile values of the data, | ||
| with a line at the median (Q2).The whiskers extend from the edges |
There was a problem hiding this comment.
Missing space after the period.
pandas/plotting/_core.py
Outdated
| layout : tuple (rows, columns), optional | ||
| For example, (3, 5) will display the subplots | ||
| using 3 columns and 5 rows, starting from the top-left. | ||
| return_type : {None, 'axes', 'dict', 'both'}, default 'axes' |
There was a problem hiding this comment.
I think the convention would be {'axes', 'dict', 'both'} or None, default 'axes'.
There was a problem hiding this comment.
Changed it, but isn't it more confusing with one of the possible values outside the dict?
There was a problem hiding this comment.
It's a good point, I didn't see it this way. But I think the idea is that None is seen more as a type than as a value in this case. The format would be: {'small', 'large'} or int. So, may be the "right" way would be {'axes', 'dict', 'both'} or NoneType or the one you had with the None inside. But if I'm not mistaken everywhere else te None is outside as None. And to me it's probably a bit clearer.
pandas/plotting/_core.py
Outdated
| See Also | ||
| -------- | ||
| matplotlib.pyplot.boxplot : Make a box and whisker plot. | ||
| matplotlib.pyplot.hist : Make a histogram. |
There was a problem hiding this comment.
If we consider hist a related method, and I agree it is, I'd also add here the pandas version (Series.plot.hist).
For the matplotlib ones, I'd use something like "Matplotlib equivalent boxplot", or something like that. I find it slightly confusing that the description is kind of the same as this method, and not explain why.
If we add the pandas hist, may be we can leave the matplotlib out, as it should be linked from its page.
|
|
||
| >>> np.random.seed(1234) | ||
| >>> df = pd.DataFrame(np.random.randn(10,4), | ||
| ... columns=['Col1', 'Col2', 'Col3', 'Col4']) |
There was a problem hiding this comment.
Is it a problem with the .. plot:: directive to create df in a previous block? If it's not, in most documentation pages what I've seen is:
>>> df = ...>>> dfor>>> df.head()if it's long- Some explanation of the function,
boxplotin this case df.boxplot()
I think it's a bit more clear that the user first sees the data for the example, and then the explanations and the function usage is shown.
If that's a problem with .. plot:: just leave it as it is, is not a big deal.
There was a problem hiding this comment.
It's been discussed before. I think that it is clearer for the user to know what dataframe is using since many types of grouping can be done and it is more explicit this way. For consistency, I took the examples from Pandas Documentation: Plotting with matplotlib: Box-plotting where a new dataframe is created for each example.
There was a problem hiding this comment.
Fair enough, I missed that discussion, sorry.
0756028 to
478ed1a
Compare
… of examples for return_type
…eturn_type values
…st and corrected format issues
478ed1a to
487352b
Compare
|
@TomAugspurger, no errors aside from **kwds |
|
Result:
|


|
@mabelvj Thanks a lot !! |
|
Thank you! I've learned a lot! |
scripts/validate_docstrings.py pandas.DataFrame.boxplotgit diff upstream/master -u -- "*.py" | flake8 --diffpython doc/make.py --single pandas.DataFrame.boxplot@EliosMolina