Skip to content

Plotting two time series in same Axes: Overflow/wrapping problem #22586

New issue

Have a question about this project? Sign up for a free GitHub account to open an issue and contact its maintainers and the community.

By clicking “Sign up for GitHub”, you agree to our terms of service and privacy statement. We’ll occasionally send you account related emails.

Already on GitHub? Sign in to your account

Closed
jgehrcke opened this issue Sep 4, 2018 · 2 comments
Closed

Plotting two time series in same Axes: Overflow/wrapping problem #22586

jgehrcke opened this issue Sep 4, 2018 · 2 comments
Labels

Comments

@jgehrcke
Copy link
Contributor

jgehrcke commented Sep 4, 2018

Code Sample, a copy-pastable example if possible

import pandas as pd
import numpy as np
import matplotlib.pyplot as plt

pd.show_versions()

L = 5
index_wo_seconds = pd.date_range('1/1/2018', periods=L, freq='D')

ts1 = pd.Series(np.random.randn(L), index=index_wo_seconds)
ts2 = pd.Series(np.random.randn(L), index=index_wo_seconds)

ts3 = ts1.shift(1, freq='s')
ts4 = ts2.shift(1, freq='s')

# Different data, same index (with seconds)
fig = plt.figure()
ax = fig.gca()
ts3.plot(ax=ax)
ts4.plot(ax=ax)
print('\n\n Time series in first plot:')
print(ts3)
print(ts4)
plt.savefig('repro-ts3-ts4.png')

fig = plt.figure()
ax = fig.gca()
ts1.plot(ax=ax)
ts4.plot(ax=ax)
print('\n\n Time series in second plot:')
print(ts1)
print(ts4)
plt.savefig('repro-ts1-ts4.png')

print('Repr of individual value in index in ts1: %s' % (repr(ts1.index[0]), ))
print('Repr of index in ts1: %s' % (repr(ts1.index), ))
print('Repr of individual value in index in ts4: %s' % (repr(ts4.index[0]), ))
print('Repr of index in ts4: %s' % (repr(ts4.index), ))
plt.show()

Problem description

When plotting two time series side-by-side in the same Axes object then something unexpected is happening when two two time series indices do not have the same "resolution".

First plot from repro:
repro-ts3-ts4

Second plot from repro:
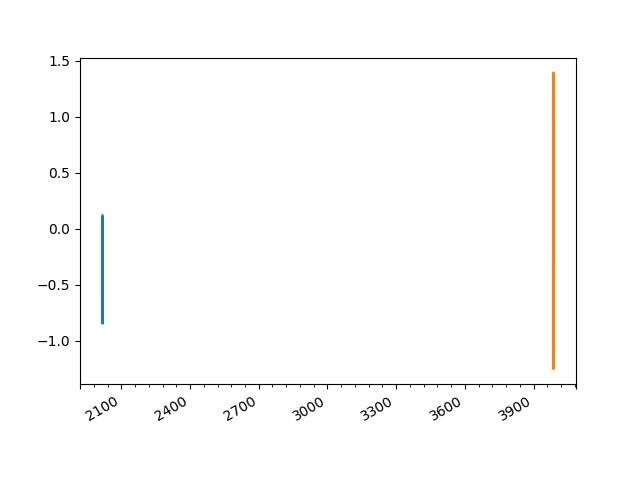
repro-ts1-ts4

Output of repro:

$ python repro.py 

INSTALLED VERSIONS
------------------
commit: None
python: 3.6.6.final.0
python-bits: 64
OS: Linux
OS-release: 4.16.7-200.fc27.x86_64
machine: x86_64
processor: x86_64
byteorder: little
LC_ALL: None
LANG: en_US.UTF-8
LOCALE: en_US.UTF-8

pandas: 0.23.4
pytest: None
pip: 10.0.1
setuptools: 39.0.1
Cython: None
numpy: 1.15.0
scipy: None
pyarrow: None
xarray: None
IPython: 6.5.0
sphinx: None
patsy: None
dateutil: 2.7.3
pytz: 2018.5
blosc: None
bottleneck: None
tables: None
numexpr: None
feather: None
matplotlib: 2.2.3
openpyxl: None
xlrd: None
xlwt: None
xlsxwriter: 1.0.5
lxml: None
bs4: None
html5lib: 1.0.1
sqlalchemy: None
pymysql: None
psycopg2: None
jinja2: 2.10
s3fs: None
fastparquet: None
pandas_gbq: None
pandas_datareader: None


 Time series in first plot:
2018-01-01 00:00:01    0.120693
2018-01-02 00:00:01   -0.336999
2018-01-03 00:00:01   -0.847296
2018-01-04 00:00:01    0.110183
2018-01-05 00:00:01   -0.592696
Freq: D, dtype: float64
2018-01-01 00:00:01   -0.264522
2018-01-02 00:00:01    0.686366
2018-01-03 00:00:01    1.395553
2018-01-04 00:00:01   -1.253022
2018-01-05 00:00:01    0.946409
Freq: D, dtype: float64


 Time series in second plot:
2018-01-01    0.120693
2018-01-02   -0.336999
2018-01-03   -0.847296
2018-01-04    0.110183
2018-01-05   -0.592696
Freq: D, dtype: float64
2018-01-01 00:00:01   -0.264522
2018-01-02 00:00:01    0.686366
2018-01-03 00:00:01    1.395553
2018-01-04 00:00:01   -1.253022
2018-01-05 00:00:01    0.946409
Freq: D, dtype: float64
Repr of individual value in index in ts1: Timestamp('2018-01-01 00:00:00', freq='D')
Repr of index in ts1: DatetimeIndex(['2018-01-01', '2018-01-02', '2018-01-03', '2018-01-04',
               '2018-01-05'],
              dtype='datetime64[ns]', freq='D')
Repr of individual value in index in ts4: Timestamp('2018-01-01 00:00:01', freq='D')
Repr of index in ts4: DatetimeIndex(['2018-01-01 00:00:01', '2018-01-02 00:00:01',
               '2018-01-03 00:00:01', '2018-01-04 00:00:01',
               '2018-01-05 00:00:01'],
              dtype='datetime64[ns]', freq='D')

In the second plot, I expect the two time series to be plotted with a time shift of one second (the two plots should basically look the same). Instead, we see something unexpected (some wrapping/overflow behavior?).

As a side note:

  • I would like to understand: where in the documentation is it documented that when I print() a Series that a line such as 2018-01-01 0.120693 (with the timestamp being given without hh:mm:ss) actually means 2018-01-01 00:00:00? This behavior makes perfect sense, and this is how pandas seems to consistently behave, but I had a hard time finding this documented.
  • What can I do so that print(ts) actually shows the 00:00:00 instead of hiding it? When I add a second via shift() or via adding an Offset() then it shows 00:00:01. When I remove it again then it falls back to not showing 00:00:00. The underlying data type does not seem to change (as far as I can tell based on dtype='datetime64[ns]', freq='D'). So, I thought maybe it really is just a question of the print/textual representation. Then again, the current issue at hand suggests that there is a difference between both (showing hh:mm:ss vs. not showing it) in the underlying data type.

Output of pd.show_versions()

See above, part of repro output.

@alimcmaster1
Copy link
Member

Hey is this a pandas issues? Regarding the plotting issue you first mentioned it seems like you are describing more of a matplotlib issue which you should raise with them?

If its a issue on the pandas side can you try reproduce in minimal code?

Thanks

@jbrockmendel jbrockmendel added the Visualization plotting label Sep 29, 2018
jgehrcke added a commit to jgehrcke/ci-analysis that referenced this issue Dec 7, 2020
There's a lot of magic going on between how the datetime64 values
actually encode datetime in plots. Sharing an axis across (sub)plots is
brittle w.r.t. these differences. Work around this, here: make it so that
individual timestamps have a non-zero value for seconds, by simply adding
one second, shifting the whole data set by one second to the left. That
prevents, I guess, an optimization to hit in which would see that
individual timestamps hit the full hour or integer  multiples of 30 or 15
minutes. Also see

 pandas-dev/pandas#15874
 pandas-dev/pandas#15071
 pandas-dev/pandas#31074
 pandas-dev/pandas#29705
 pandas-dev/pandas#29719
 pandas-dev/pandas#18571
 pandas-dev/pandas#11574
 pandas-dev/pandas#22586
@mroeschke
Copy link
Member

It appears that this may be more of a matplotlib issue than a pandas issue unless we can get a simpler example. Closing as it's not clear that this is a pandas issue but happy to reopen if it is.

Sign up for free to join this conversation on GitHub. Already have an account? Sign in to comment
Labels
Projects
None yet
Development

No branches or pull requests

4 participants