Invalid or erroneous drawdown calculations in equity plot for resampled datasets #162
Comments
Resampling of equity curve is computed this way: backtesting.py/backtesting/_plotting.py Line 118 in 05329de backtesting.py/backtesting/lib.py Lines 62 to 66 in 05329de ( 'Equity' should maybe aggregate with 'last'. 🤔)
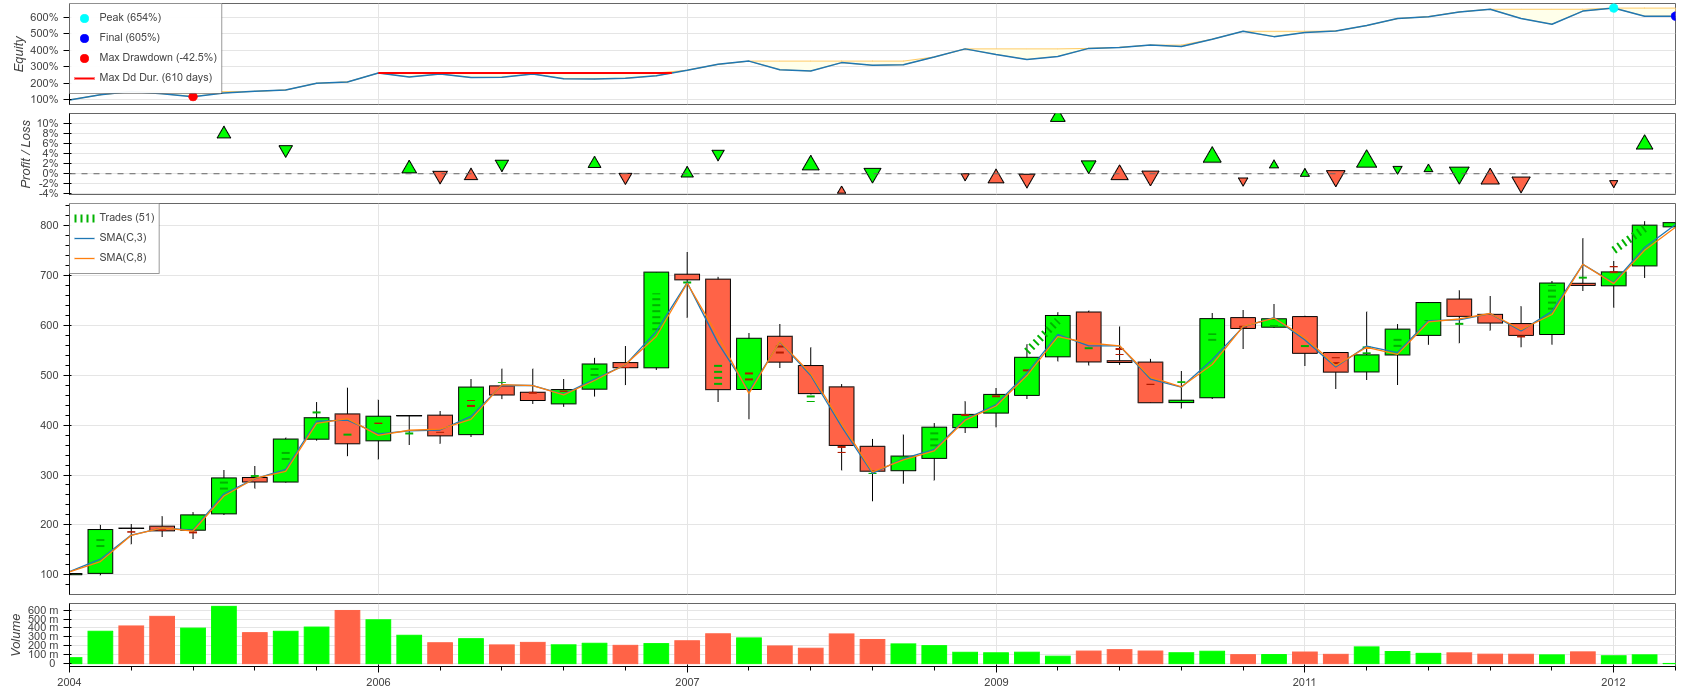
Interestingly, the whole thing works correctly (conjecture) on this toy example: from backtesting.test._test import SmaCross
bt = Backtest(GOOG, SmaCross)
bt.run(fast=3, slow=8)
bt.plot()
bt.plot(resample='2M', superimpose=False)
Max DD Duration seems to be rounded to round units (10 2-months). Therefore, it must be something specific to your dataset and something in the way drawdown intersections are computed: backtesting.py/backtesting/_plotting.py Lines 277 to 290 in 05329de backtesting.py/backtesting/_plotting.py Lines 354 to 359 in 05329de I don't suppose something strikes you as odd at first glance? 😅 |

That did the trick. Here is the before picture with a zoom in on the problem period. Here is an after picture after I set the The Max Drawdown Duration perfectly matches what is expected from the _compute_stats calculations. |


|
Pleasure to work with you. |
Expected Behavior
Plots, where data was resampled due to >10,000 bars, should calculate max drawdowns and drawdown periods similar to those computed in the _compute_stats method
Actual Behavior
It appears when plots are downsampled in the Backtest.plot(resample=True) the drawdown calculations and possibly drawdown duration (beginning and ending periods) are miscalculated.
Here are two examples of such charts:
https://www.realitysharesadvisors.com/fund_dash/fix_this_eth.html
https://www.realitysharesadvisors.com/fund_dash/fix_this.html
Note the legend in one of the charts showing 0 days of max drawdown

Here is an example where the red line is misplaced on an incorrect drawdown.

Steps to Reproduce
Additional info
This was also referenced in a different issue #156 (comment)
The text was updated successfully, but these errors were encountered: