Potential memory leak #1417
Comments
|
Can you create a small, self-contained script that can be used to reproduce the leak, please? Also: which version of Node are you using? |
|
Running Node 7.10.1; I'll try to work on a small script. |
|
@charmander here you go! Set upUsing [email protected], node 7.10.1, and this schema: https://github.com/Neamar/teamward-server/blob/master/lib/model/sql/queries/fixtures.sql (no need to insert any data) ScriptThe following script will leak (replace line 2 with your credentials, you'll need to run "use strict";
var sqlUrl = "postgres://test:test@localhost/teamward-dev";
var async = require("async");
"use strict";
var Pool = require("pg").Pool;
var url = require("url");
function createPool(maxConnections) {
const params = url.parse(sqlUrl);
const auth = params.auth.split(':');
var pool = new Pool({
user: auth[0],
password: auth[1],
host: params.hostname,
port: params.port,
database: params.pathname.split('/')[1],
ssl: true,
min: 2,
max: maxConnections
});
return pool;
}
var defaultPool = createPool(10);
var lastSeasonRankQuery = "select summoner_id, last_season from matches_participants where summoner_id = ANY($1)";
var participants = [ 258150, 9791994, 8510725, 8551706, 8790867, 948419, 129496, 11620511, 4830329, 6611709 ];
var count = 400000;
async.timesLimit(count, 10, function(i, cb) {
if(i % 10000 === 0) {
console.log(i + "/" + count);
}
defaultPool.query(lastSeasonRankQuery, [participants], function() {
// Discard any results
cb();
});
}, function() {
console.log("DONE");
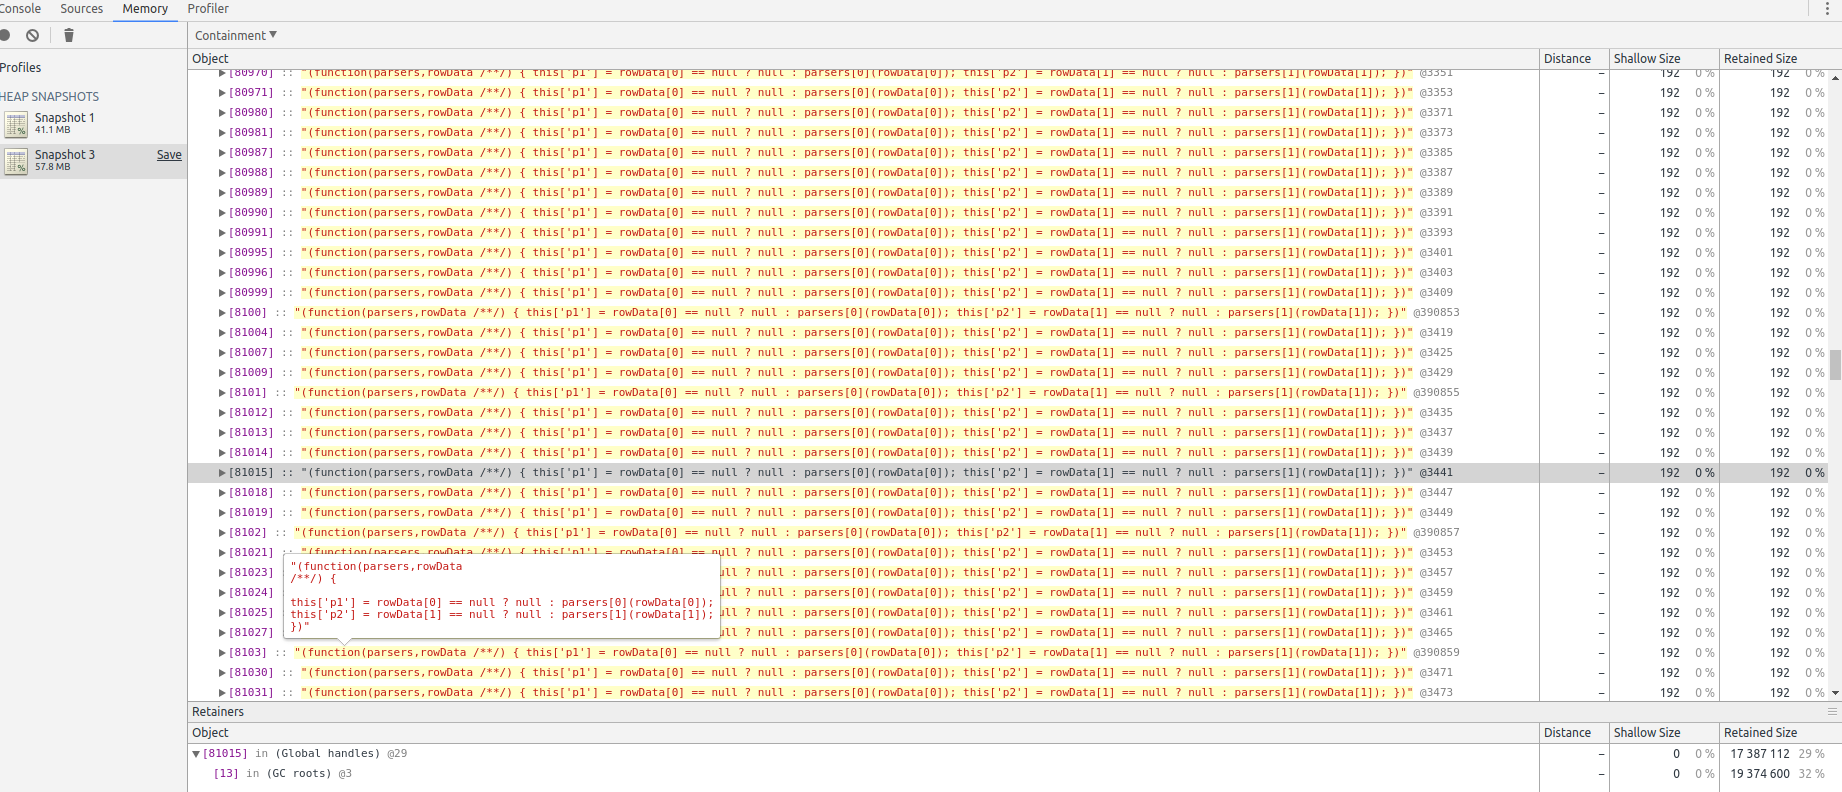
});Running this script will reserve more and more memory. How to?Run with Wait for a couple minutes for the script to run (depends on your computer, but hsould be less than 10 minutes), and when you see "DONE" on the terminal, garbage collect again and redo a heap snapshot. This time the snapshot will be around 70mb. Click on the second heap snapshot. On the top bar, switch from "Summary" to "Containment", and expand "(GC roots)" and then "(Global handles)". (function(parsers,rowData
/**/) {
this['summoner_id'] = rowData[0] == null ? null : parsers[0](rowData[0]);
this['last_season'] = rowData[1] == null ? null : parsers[1](rowData[1]);
})each weighting 216 bytes -- not much, but it add fast. I'm probably wrong somewhere, since the script is relatively simple, but it is the same behavior I'm seeing in my larger app. My analysisIt look (but I'm not a PG expert) that the fact that this query is running on a PG custom type might be causing the problem: CREATE TYPE rankType AS ENUM('UNRANKED','BRONZE','SILVER','GOLD','PLATINUM','DIAMOND','MASTER','CHALLENGER');Running on a table with integers only doesn't cause any leak. |
|
I think this is a debugger bug. Consider this script, whose memory usage under 'use strict';
for (let i = 0;; i++) {
Function('return ' + ++i)();
}It’s understandable how this could make memory leaks hard to track down, though, and I had been planning on comparing the performance of a well-optimized parser that doesn’t rely on generated JavaScript under modern Node anyway, so maybe an option to disable that could suit your needs as well. |
|
@charmander Yeah I've been considering removing the generated JavaScript parser as well - I don't think it does as much good as it did when it was introduced. When it was added node was on v0.6 i believe and a much earlier version of v8. I just need a bit of time & I can run some benchmarks and figure out the impact. |
|
@brianc The impact still seems to be there – at least a difference of 20% in some common cases I tried. Maybe more interesting, though: pg-native performed worse than the current pg in every case. Do you know of any situations it still handles better than the JavaScript driver? It would cut down on a lot of complexity if it were dropped, but maybe that’s too optimistic =) |
|
@charmander I get your point about the debugger, but I think it's worth noting two things:
I'm a little disappointed that you closed the issue, since it's still a real issue (at least for me), and the snippet posted above highlights a difference in behavior depending on the PG schema which shouldn't happen. |
Yes, that’s because it’s the result parser creating functions dynamically.
I couldn’t reproduce this. Which query were you using to select only integers? |
I thought you said it was a debugger bug. But if it's still happening in prod, without the inspector, doesn't it mean that something is off in the result parser?
I was using this table instead of the schema linked above: CREATE TABLE public.matches_participants
(
id SERIAL,
summoner_id integer,
last_season integer NOT NULL
);and the memory remained constant |
Using your minimal test case, are you able to produce a leak with |
|
Good point. I do see a lot of Garbage collection, and memory usage does go up slightly, but nothing comparable to running with Sorry for the noise, as you say having an unreliable Sorry for the noise, |
|
Well, that’s a relief =) If you can create a new script that leaks without |
|
@charmander actually... I left the script running during the night. The only change I did were running without After roughly 3 hours, I got... This could be related to using async.timesLimit, but I don't think it will generate so much memory. I'll run another test tonight without async. Just thought I'd mention it here for now! |
|
Just to update -- wasn't able to reproduce without |
|
Root cause seemed to be the combination of NewRelic and PG. Probable bugfix here: brianc/node-pg-pool#83 |
|
I just hit this as well - thank you @Neamar for doing the groundwork here, this was a really hard one to follow. We had over 82K of these sitting around in memory (512mb) in some cases. I'll give that PR a try and see if it resolves any other memory issues. @charmander Can you reopen this? I think everyone is agreed that removing the dynamically generated functions is a good idea. |
|
@contra That PR is unrelated to the dynamic functions, but if it doesn’t fix the problem (outside of debug mode) for you, I can set up a PR that is related to try next. =) |
|
@charmander Yep, I'm aware that PR is for a totally unrelated issue. We have two leaks in our application right now that were both mentioned in this PR which is the only reason I brought the other one up. One is the dynamic functions, the other is that newrelic/pg-pool issue. Don't want to go off topic though so let's stick to the dynamic functions. I'm 100% able to reproduce it with inspect on, up to 512MB of memory used before it crashes. I'm running an API for about an hour, then opening the debugger for the first time and doing a heap dump. I think having delayed the debugger being opened until the last minute to take the heap dump would rule out that the debugger being open is causing the memory leak, but I could be wrong. Now that we have the other memory leak fixed I should be able to isolate this one easier, so I'll follow up with more info as I get it. |
|
@charmander I'm going to put a heapdump up for you, here is a preview:
This was from sending ~6 read requests every 2 seconds for ~30 minutes. Can't provide the code since this is from our actual product, but it isn't anything special. 1 HTTP request = 1 read from postgres via sequelize (and thus node-postgres). Before any activity: After: If you do a comparison between before/after in devtools you'll see all of the memory allocated between them is from the dynamic functions - the top allocation chunk is the actual compiled functions, the second is the actual strings. A short-term potential fix would be to cache the functions maybe? I don't think there needs to be 2K instances of a function to parse the same row format - we can just reuse the same one over and over, and wouldn't pose a problem unless somebody had massive amounts of tables where the parser function string was different. For reference, here is another library that uses dynamically generated functions to parse rows - https://github.com/mafintosh/csv-parser/blob/master/index.js (this just does one per csv file though, whereas node-postgres does one per result). |

@contra And with inspect off? |
|
@charmander Yep - and when I switched our |
|
@contra are you going to open a pr against this repo? |
|
Using @contra's branch: now vs before |
|
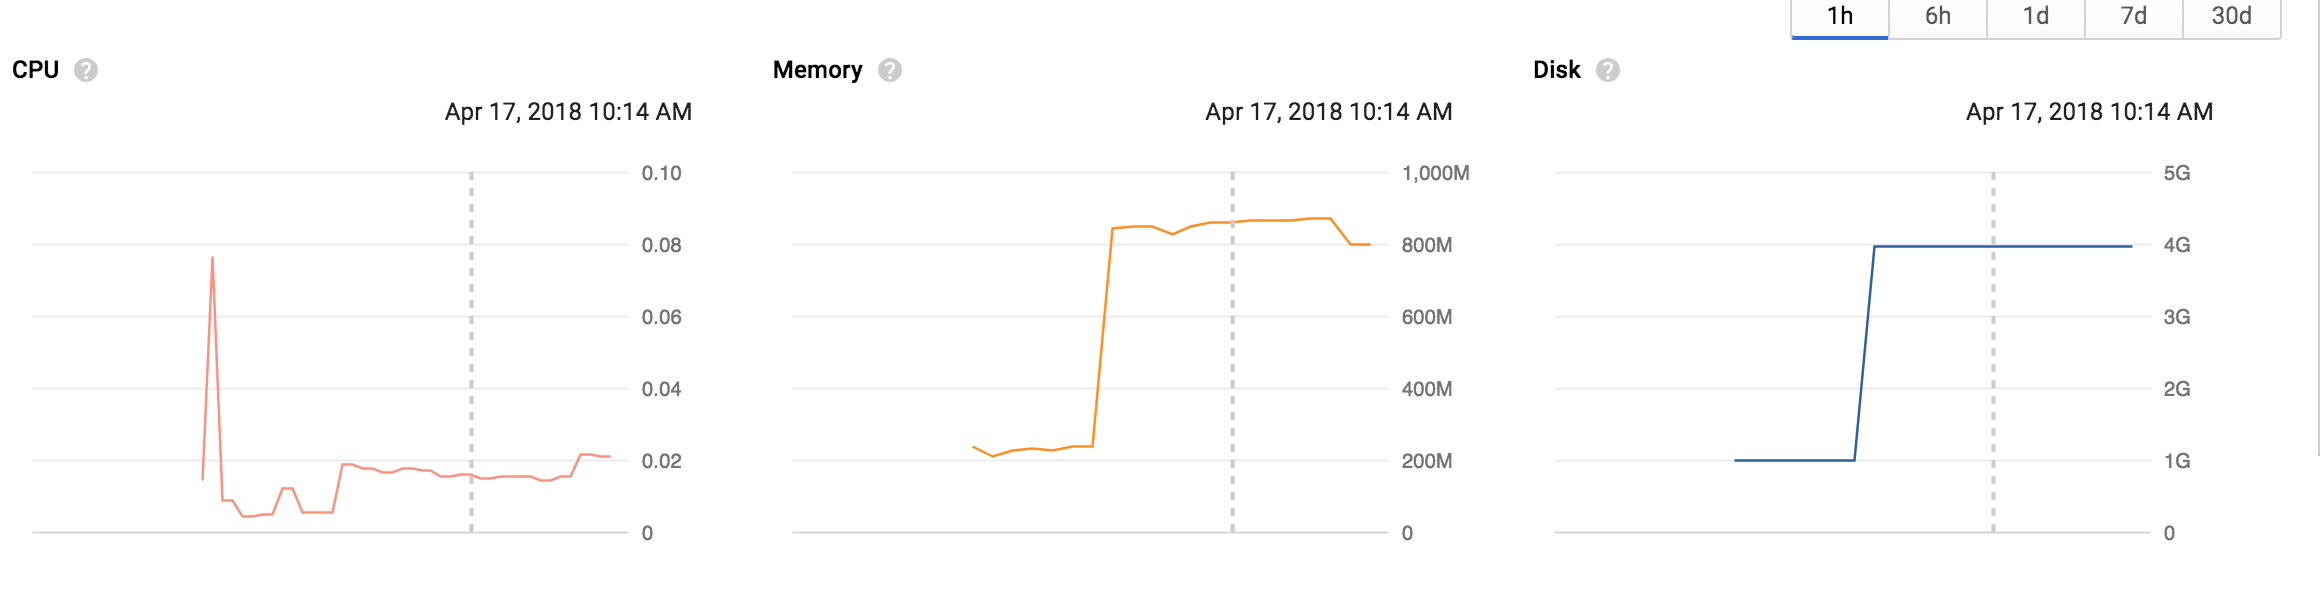
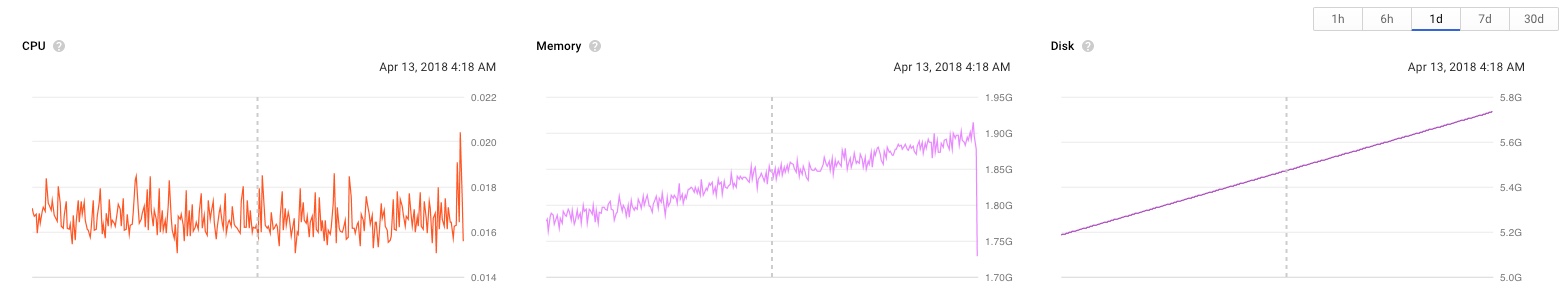
@calvinmetcalf I opened a PR already - #1603 I doubt it will get merged because nobody will acknowledge that this is an actual problem. @knownasilya Sweet! I'm assuming the 800M is from somewhere else, that seems pretty high for a base RAM. Still better than 1.9GB it was before. |
|
@contra that is a combination of 4 pods in a cluster, so it's the total memory of 4 active apps. This is surely a problem. Memory keeps growing and then swap is used and that increases disk so the memory lows keep rising and sooner or later the pods get evicted because resources get used up. |
|
I'm facing the same problem - I think LRU cache might help but I'm currently fine with Something like: |
specifically aimed at updating pg so as to to fix
brianc/node-postgres#1417
Uh oh!
There was an error while loading. Please reload this page.
Hi,
Im' investigating a memory leak in one of my app. It seems that this module is generating thousands of strings containing:
(displayed here as a function, but it is actually a String).
Those seems to be generated in
pg/lib/result.js::inlineParser, related to #507:Here is an example result from memory analysis using dev tools:
(screenshot: only displaying items created after establishing a memory baseline, and after a forced Garbage collection. I'm only displaying one screen here, but I can scroll for ages on the exact same string).
This leak isn't super fast, it takes roughly a day to OOM on a relatively busy server (70k rpm, around 100 requests to PG/s).
I could also be using the library in a bad way, but the fact that all those strings remains and not my queries is weird.
Thanks,
The text was updated successfully, but these errors were encountered: