Debugging session does not end, even after selecting "Stop Debugging" #1022
Comments
|
Same problem for me - really frustrating |
|
This sounds like issue #625 to me. If you don't try removing the breakpoints, does everything work as expected for you? Trying to determine whether it's actually an issue of the debugger not stopping or the breakpoints still sticking around for the next debugger run. |
|
It may be related, but what I do know of my situation is that I have tried this with and without removing the breakpoints and the result is the same. Visually when I remove the breakpoints, they do appear to be gone but the debugger still seems to want to stop at them when re-running the powershell script. Underneath the hood of course, they may not be gone?
Thanks for looking into this, I appreciate it.
Anthony
Anthony Gregg | Technical Lead | Retail Development | Application Development & Maintenance | Best Buy | A5-071 | Ph.: (612) 291-2350 | Cell: (612) 231-0011 [cid:[email protected]] <http://www.bestbuy.com/>
TFS Requests: Service Now <https://bestbuy.service-now.com/> – Self Service -> Request Catalog -> IT Infrastructure -> TFS Support Requests
From: David Wilson [mailto:[email protected]]
Sent: Thursday, October 26, 2017 11:57 AM
To: PowerShell/vscode-powershell <[email protected]>
Cc: Gregg, Anthony <[email protected]>; Author <[email protected]>
Subject: Re: [PowerShell/vscode-powershell] Debugging session does not end, even after selecting "Stop Debugging" (#1022)
This sounds like issue #625<https://na01.safelinks.protection.outlook.com/?url=https%3A%2F%2Fgithub.com%2FPowerShell%2Fvscode-powershell%2Fissues%2F625&data=02%7C01%7Canthony.gregg%40bestbuy.com%7C29171fe456014e67235e08d51c928af8%7C135e89957d3b4466844ba0d62ba5f495%7C0%7C0%7C636446338073140206&sdata=Q3ahpgliAoQ%2FpIS8icK5SWX3w0LsJA4Lvn6nbZEHF3I%3D&reserved=0> to me. If you don't try removing the breakpoints, does everything work as expected for you? Trying to determine whether it's actually an issue of the debugger not stopping or the breakpoints still sticking around for the next debugger run.
—
You are receiving this because you authored the thread.
Reply to this email directly, view it on GitHub<https://na01.safelinks.protection.outlook.com/?url=https%3A%2F%2Fgithub.com%2FPowerShell%2Fvscode-powershell%2Fissues%2F1022%23issuecomment-339730790&data=02%7C01%7Canthony.gregg%40bestbuy.com%7C29171fe456014e67235e08d51c928af8%7C135e89957d3b4466844ba0d62ba5f495%7C0%7C0%7C636446338073140206&sdata=yVdUk4BzPQnYrcIfkPWiayTBbTqXmR1rqUETA3%2Fm30o%3D&reserved=0>, or mute the thread<https://na01.safelinks.protection.outlook.com/?url=https%3A%2F%2Fgithub.com%2Fnotifications%2Funsubscribe-auth%2FAWTaEmkBTHbNPsJl8bBMNQB7pEuqXVqWks5swLnMgaJpZM4PNpLA&data=02%7C01%7Canthony.gregg%40bestbuy.com%7C29171fe456014e67235e08d51c928af8%7C135e89957d3b4466844ba0d62ba5f495%7C0%7C0%7C636446338073140206&sdata=9XsWSQlowCW2C%2B6K9XsUPdmCUgSubHBQ6bjD%2FWGqvNk%3D&reserved=0>.
|
|
@anthony-gregg Can you zip and attach your log files here? As for the original issue, you can request that the PowerShell extension for VSCode uses a new, temporary session during debugging. This ensures you start with a fresh session when you start debugging. To enable this, add this setting to your user settings file: |
|
I am getting exactly same issue on mac with Version 1.18.0 |
|
Mine too. In fact even though you select Stop-Debugging, I noticed the [DBG] prompt never went away. Subsequent debugging entered further and futher nested prompts until breakpoints were outright ignored. Had to type 'q' in the console window to exit out of all sessions |
|
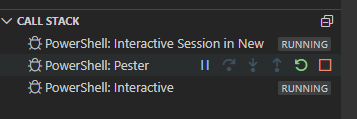
@SydneyhSmith @TylerLeonhardt this is more specifically covered in #2371 in terms of the larger conversation of whether to cleanup breakpoints for users. Some documentation around having multiple debug sessions in the queue may be useful for visibility of "hung" debug sessions, though the newest vscode makes this MUCH easier to view, troubleshoot, and cleanup in the "Call Stack" Pane: |
|
Thanks @JustinGrote I will mark this issue as a duplicate and we can refer to #2371 going forward. Your comment around documentation is valid and is likely something we should consider- Thanks! |
|
This issue has been marked as duplicate and has not had any activity for 1 day. It has been closed for housekeeping purposes. |
System Details
$PSVersionTable:Name Value
PSVersion 5.1.15063.502
PSEdition Desktop
PSCompatibleVersions {1.0, 2.0, 3.0, 4.0...}
BuildVersion 10.0.15063.502
CLRVersion 4.0.30319.42000
WSManStackVersion 3.0
PSRemotingProtocolVersion 2.3
SerializationVersion 1.1.0.1
Issue Description
I am experiencing a problem with... ending a debugging session. I do the following steps (assuming a powershell script is already loaded and a breakpoint has been applied):
Get-TFSGroupMembership http://TFSEnterprise:8080/tfs/Services Plugin -WriteOnly
So this is the function name, the collection URL, the Project I want to get users from and the last is a switch to tell the script to get "writeonly" users. There is a second switch which is not shown here and I have not typically used.
I have tried all sorts of things to end the debug session, but nothing ends it. I have read all the tutorials on the VS Code debugger and nothing indicates that I am doing anything wrong or missing a step (so it seems). If there is something missing I could not for the life of me find it.
Finally the only way I could get the debugging session to end was to close out of VS Code and restart it again. This terminated the debug session. Otherwise, every time I ran the script it would continue to break at the non-existent breakpoint. If I added the breakpoint back and removed it again, this did not change a thing. I showed this to a couple of other VS Code users in my company and they also thought this was a bug. I am however skeptical that it is as I would think someone for sure would have seen this by now. However I could not see any mention of it. It seems like an in your face problem that would be noticed by everyone. So I am thinking I have done something wrong. I thought I would submit it anyway and see where it goes.
Attached Logs
I am not having any errors or crashes that exhibit this problem therefore I have not included any logs based on the URL given below. If however you need me to do so, I can follow your guidance as necessary to capture any information you may need.
Follow the instructions in the README about capturing and sending logs.
The text was updated successfully, but these errors were encountered: