Support for changing time zone in a continuous timeseries chart #6519
Comments
|
Here is a code snippet showing a time change in the other direction: import plotly.express as px
import pandas as pd
df = pd.DataFrame({"time": pd.date_range("2022-03-27 00:00:00", "2022-03-27 04:00:00", freq="1h", tz="Europe/Zurich")})
df["values"] = [1, 1, 2, 1]
fig = px.line(df, x="time", y="values")
fig.show(“browser”)Where Plotly will currently show: |

|
Just to be clear on terminology: to my mind there's actually no "changing timezone" in the charts you want. The timezone is In North America the situation is a little simpler to describe (though this usage isn't universally accepted and there are a few places that don't use DST so need their own timezones):
Unfortunately Europe doesn't follow that pattern, I'm not aware of any better way to designate "the time actually observed by most of Europe" other than picking a specific city. |
|
See also: |
|
In that issue I mention both halves of what you're trying to do here: inputting times with a timezone offset (and it being a mix within a given vector) and then also having non-UTC-only display, which as AJ points out is more subtle that it seems due to daylight "savings" and summer time or whatever, i.e. the fact that you can't just express things as a UTC offset, you need to include some geo-political concept of "time as generally understood in place X" which may or may not have a standard identifier. There are historical timezone files that map Continent/City/time-range -> UTC offset (or whatever) and I guess maybe we'd need to bake one of those into Plotly.js and keep it up to date? seems big. |
|
(unless the browser has one built-in?) |
|
So if you pass a specific timezone name to your figure definition (maybe supporting the same names as |
today? no, all of this is ignored :) Looks like browsers mostly-but-don't-have-to do the right thing: https://developer.mozilla.org/en-US/docs/Web/JavaScript/Reference/Global_Objects/Date/getTimezoneOffset |
Right, my question is whether that description is how charts would behave if we added support for this |
|
sorry for splitting the convo... AJ is replying here with a possible solution #3870 |
|
one thing which would need clearing up is how you'd like to display things in the fall, when some amount of time shows up twice... Would you like a line that jags backwards? or to display time marching forward and just repeat the labels? |
|
Let's move this whole convo to #3870 |
|
Closing to track instead in #3870 |
This is an example using
pxbut I believe the core issue/feature would be resolved in Plotly.js. Happy to move this to https://github.com/plotly/plotly.py if that makes more sense.Just for reference, since October 30th crosses daylight savings, this dataset will look like this:
Notice that there are two 2am's -- one at +02 and one at +01.
In this example, Plotly will render:

What you might expect instead is that it would have two 2ams on the x-axis, so our output would look more like a triangle.
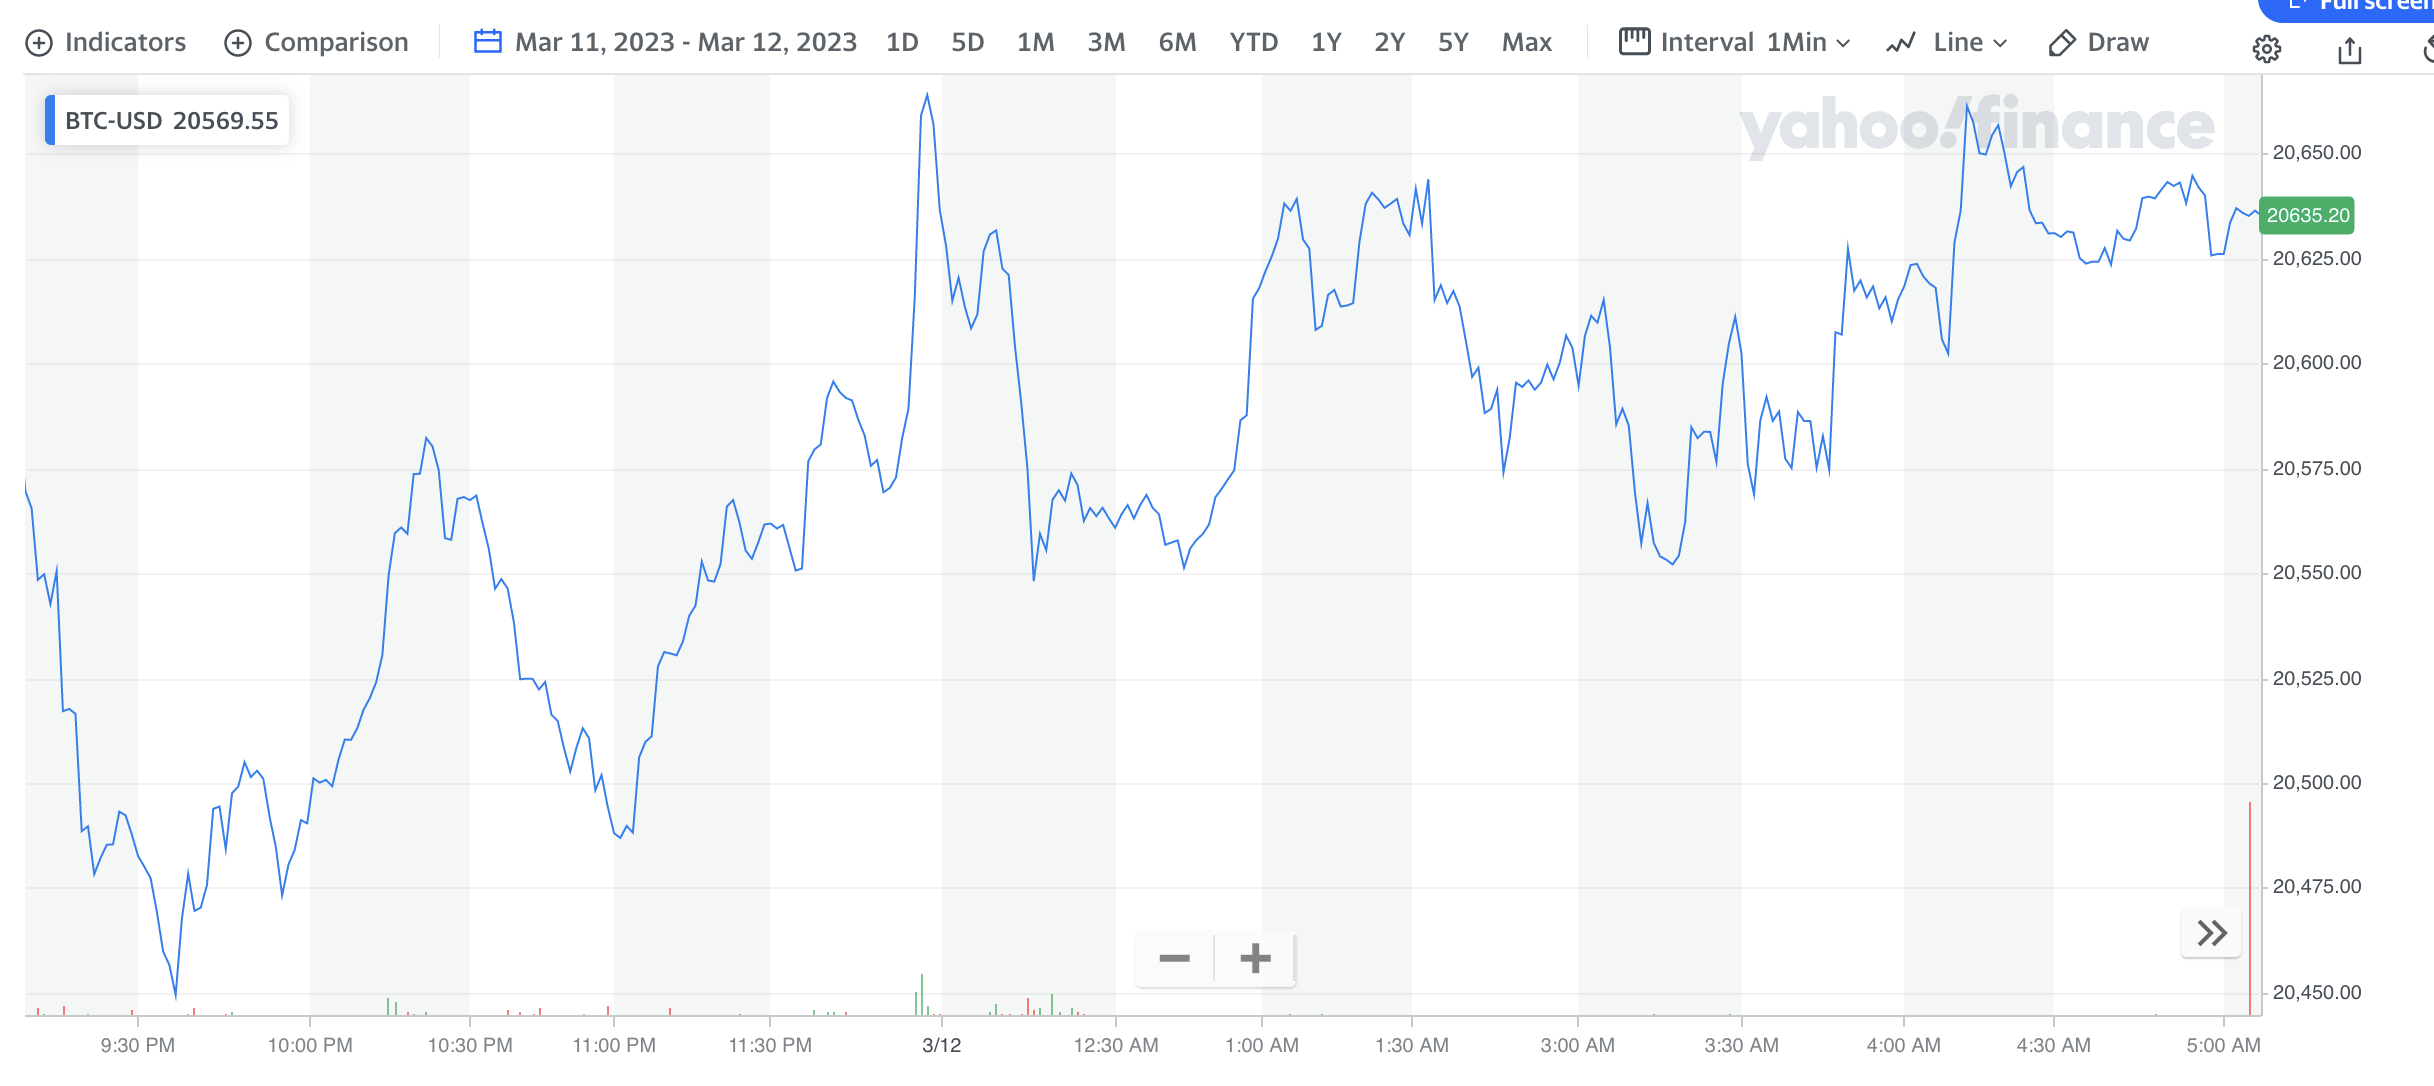
We can compare to this chart from Yahoo Finance, where we're doing daylight savings time (albeit in the other direction). Notice that 2am is never plotted here, but the data does not have a gap at 2am.
The text was updated successfully, but these errors were encountered: