Sampling (with LTTB or other algorithm) for performance on large data sets #560
Comments
|
Thanks for suggestion! Some sort of range-depending drawing options would be a great addition to plotly.js. Implementing them in a robust way won't be easy and won't be a priority of ours for at least the next six months. That said, sampling algorithms would be a great use case for soon-to-be-released trace transforms (see PR #499 for more info). |
|
Hi, this is also interesting to me. But here the problem is that downsampling has to be done on server. If I have time-series with timespan over a year and it has over 3*10^7 points (one point for every second in the year) then I can not send all the data to the javascript plot. Competition library Bokeh allows this, you just need to hook a callback function to zoom-range-change event and change replace the points in the python plot model with appropriate resolution, then the changes in the backend are automatically transferred to javascript plot via websocket. However I stopped using Bokeh, I find it difficult to use as a component in multi-component web application. Although, I have learned that this is not such a simple task. Various users might be interested in various methods of downsampling the data. I am looking into plot.ly now. As a solution I am thinking of using the javascript zoom-event function to request data from my server with a appropriate resolution. My server would provide such data via HTTP api. Would it be possible to update the plot.ly plot with the new data? |
|
@marcelnem Have you found a good solution for plotting a large number of points? I'm looking into plotting a similar sized dataset using either Bokeh or perhaps Plotly. I might have to resort to downsampling also. |
|
I'm not sure if you would find this helpful but we were also in the same situation. We ended up using Largest-Triangle-Three-Buckets algorithm (LTTB). Initially we tried using a a very simple downsampling algorithm (take the max of every n data points) but we found that LTTB retained a better "shape" of plot data. We have a Go server that does the downsampling and then pushes the data to our java script application (with Plotly JS). This is an example of the algorithm in javascript. We modified it slightly and converted it to Go. There is a link on the page to the paper of the guy who originally wrote the algorithm too. https://github.com/sveinn-steinarsson/flot-downsample I hope someone finds this helpful. |
|
Interestingly, matplotlib handles the same large data without any trouble, in my case at least. |
|
Still would be nice to have. |
|
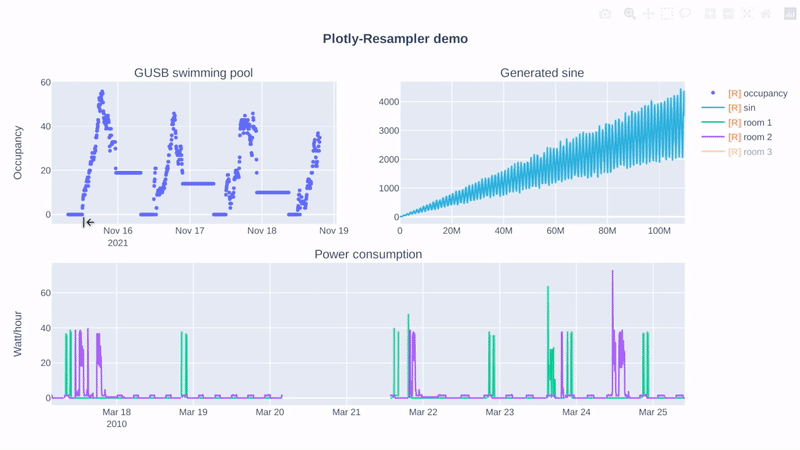
Hi, if you mainly use the Python-bindings of Plotly, this repository can help you! 😃
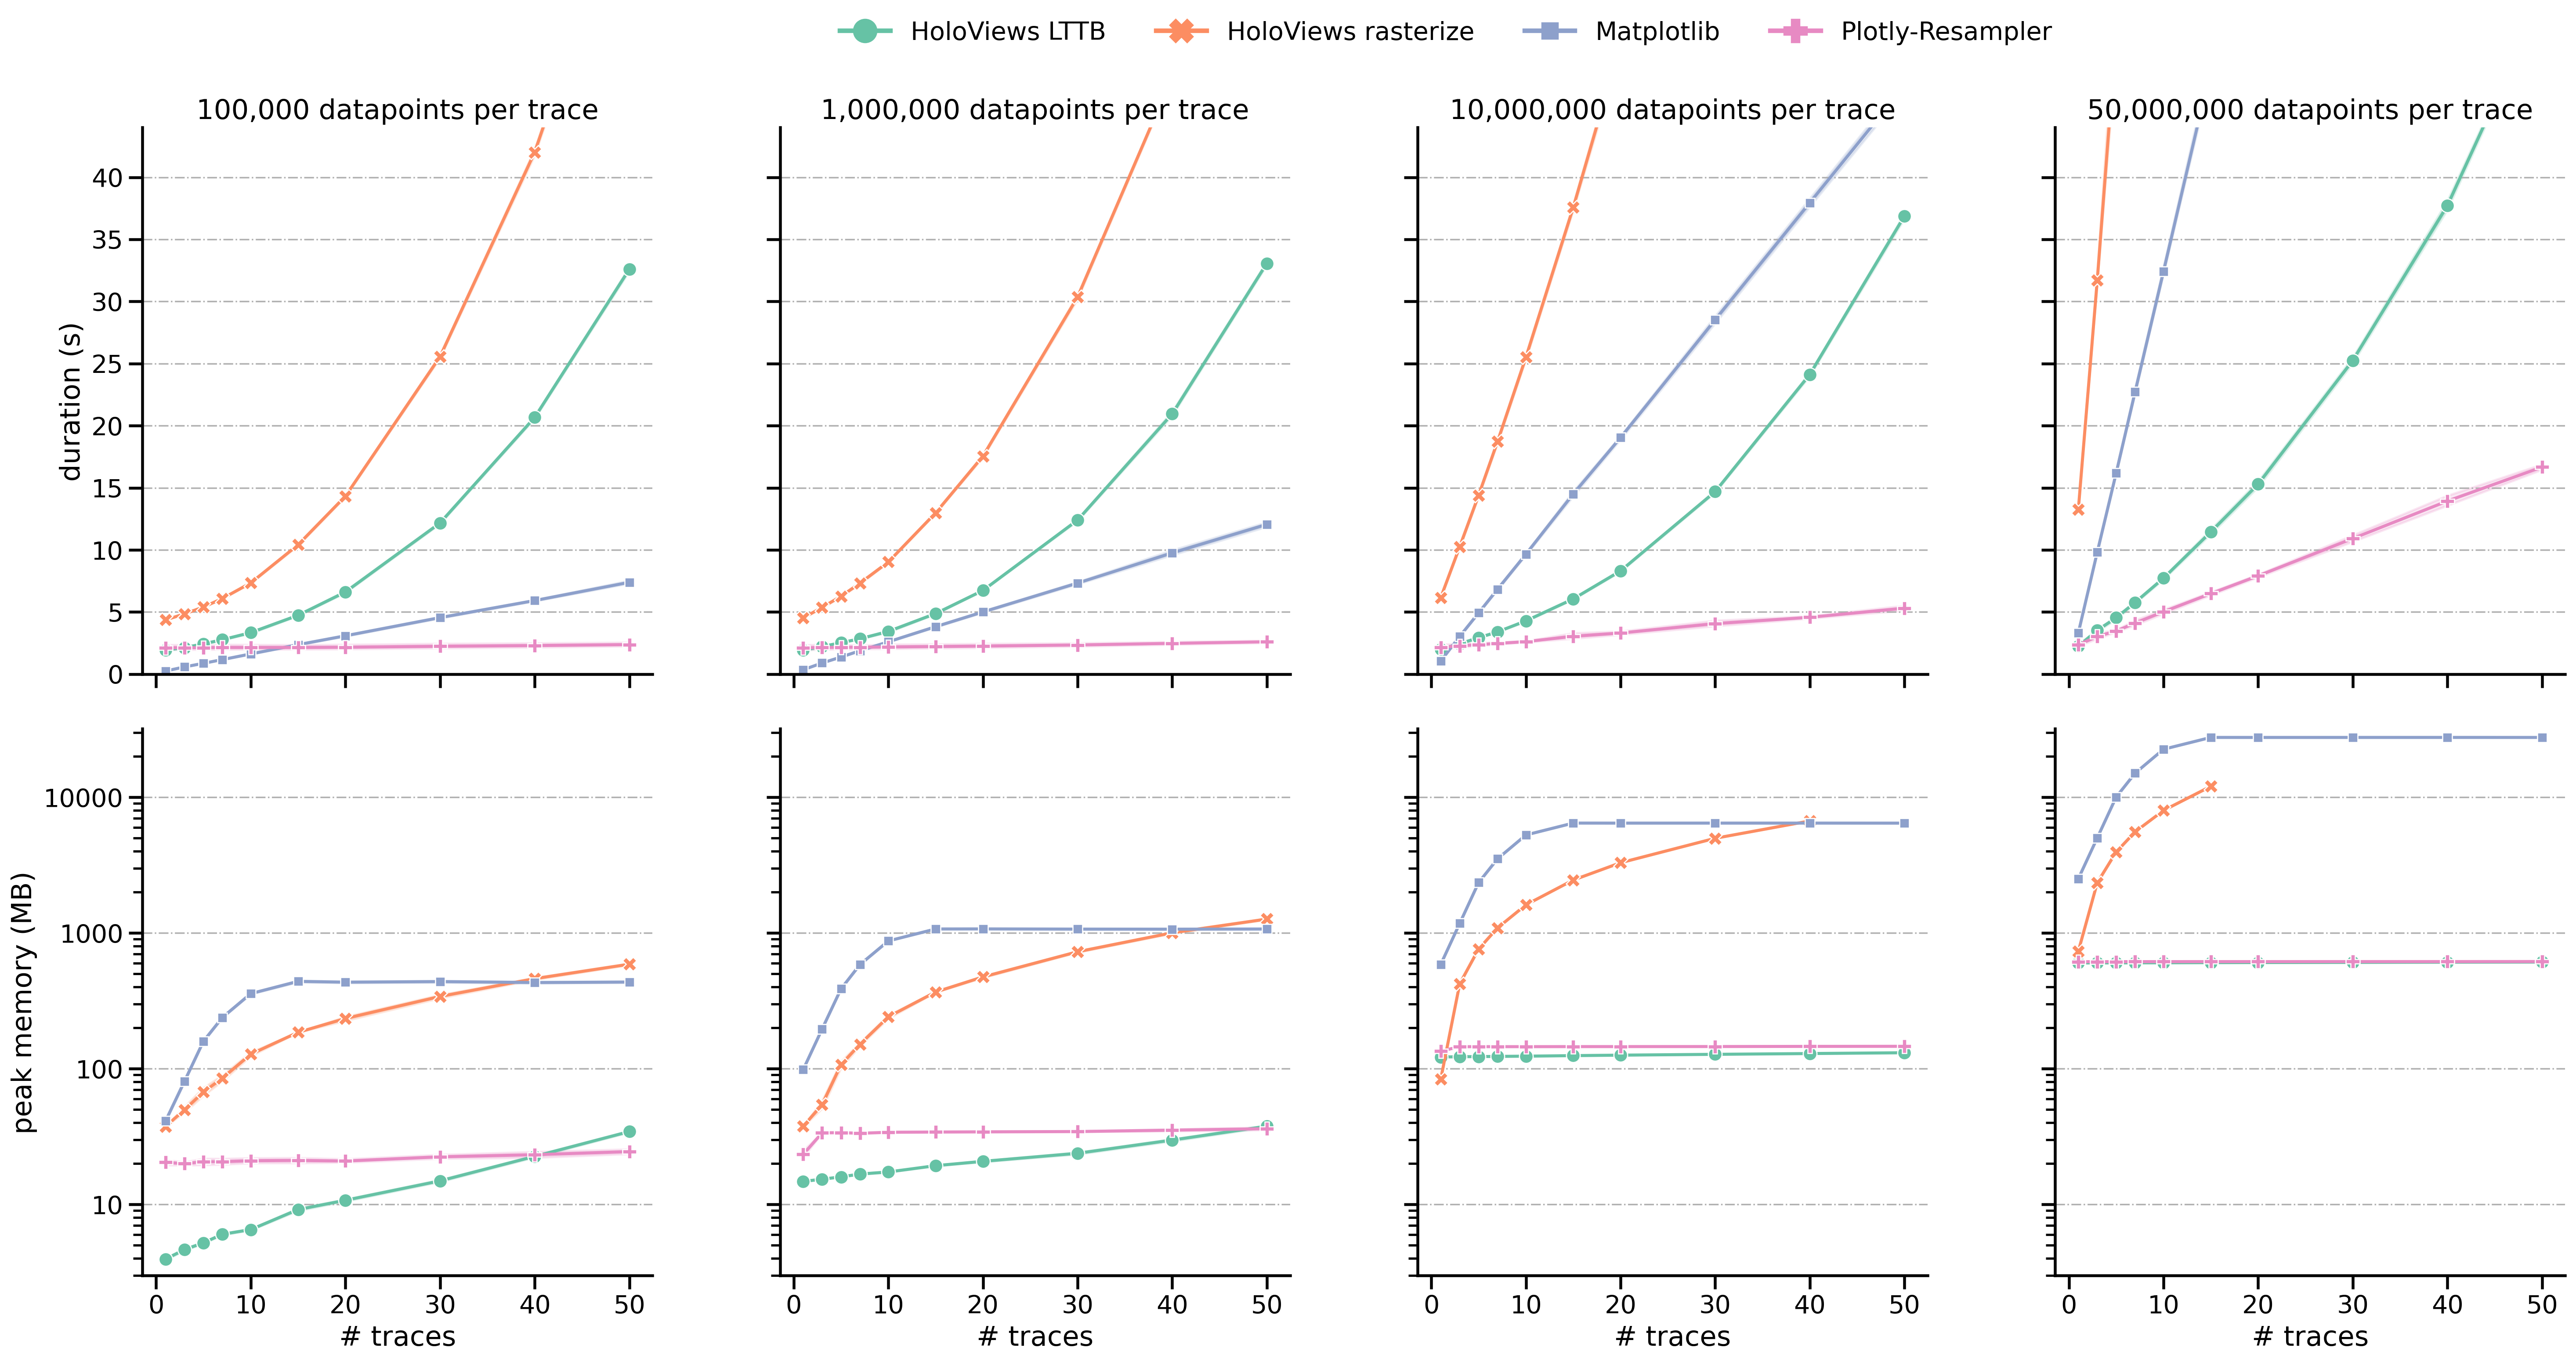
Additionally, I benchmarked a line-graph visualization task for large-multivariate data (benchmarking-code), and these are the results: (duration = graph construction + render time)
It is clear that plotly-resampler scales better when moving towards large, multivariate data. |
|
Is it useful also when dash (AFAIK an optional paid component) is not being used? |
|
Hey @matanster, The dash dependence is free 😃 (we do not use any paid components of dash), but as the front-end to back-end interaction is realized via Dash component callbacks, there is a dependency on it. I suggest you look at our repo-examples and docs to see whether it meets your requirement. if not so, you can always create an issue on our repo! |
|
Thanks, I'll be looking at using dash to support this (paid or not) next time I have that scenario! |
|
Hi - this issue has been sitting for a while, so as part of our effort to tidy up our public repositories I'm going to close it. If it's still a concern, we'd be grateful if you could open a new issue (with a short reproducible example if appropriate) so that we can add it to our stack. Cheers - @gvwilson |
Hi guys-
Really a feature request here (and I might be able to help with implementation)- I'm looking to be able to use some sort of sampling method on large datasets in plotly, similar to the sampling methods suggested here: http://hdl.handle.net/1946/15343 and implemented for flot here: https://github.com/sveinn-steinarsson/flot-downsample and in other places for other libraries. Ideally, I could load all of my data into plotly in x, y pairs and specify a max number of points to display, plotly would figure out which points to plot using the algorithm of my choice and the number of points (specified in the trace specification) then when I zoomed further in, it would first perform its normal zoom then it would resample for the new x coordinates and then redraw (or ideally not not sure exactly how it should work). Some caching of initial points etc might be in order as well.
Anyway, wondering if anyone else is looking for something like this, or if there are plans to implement, would love to work with someone on it.
The text was updated successfully, but these errors were encountered: