-
-
Notifications
You must be signed in to change notification settings - Fork 1.9k
Horizontal legend disappears depending on length of series names #4986
New issue
Have a question about this project? Sign up for a free GitHub account to open an issue and contact its maintainers and the community.
By clicking “Sign up for GitHub”, you agree to our terms of service and privacy statement. We’ll occasionally send you account related emails.
Already on GitHub? Sign in to your account
Comments
|
I created a PR in my fork as per above. Please review and see if it is acceptable. |
|
Maybe @alexcjohnson or @archmoj would like to look at it? |
|
Looks good. Could you open a PR to plotly.js repo? |
|
Sure, should I merge in the upstream master first? |
|
No it doesn't look necessary. |
|
PR submitted |
|
Thanks @fredrikw. |
|
Closed via #5139. |
Sign up for free
to join this conversation on GitHub.
Already have an account?
Sign in to comment


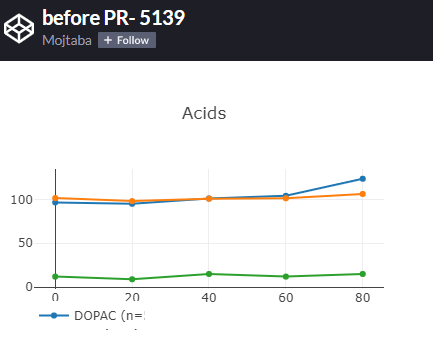
I have a graph with a horizontally oriented legend that shows a strange problem. When the total length of the legend is "exactly right" the clip path in the resulting svg gets distorted so that most of the legend is clipped of. See the following CodePen where the first plot is the problematic one. Adding or removing one character in the series names make the legend show correctly as seen in plots two and three.
https://codepen.io/fredrikwa/pen/NWxYXba
The text was updated successfully, but these errors were encountered: