Extra space gets added below and above the chart #1775
Comments
|
Assuming you're referring to the space between |
|
Closing. @saimaparveen if you have any other questions on this topic, please use https://community.plot.ly/ |
|
Hi, yaxis: { This solution works only for static data .. for me the graph data is changing that is why this solution is not working .. If data is more trace1.y.length-3 still leave space on top. Is there any way i can know what value we can minus from trace1.y.length ? |
How are you updating your data? You can use |
|
The issue is not with the update. |
Hmm. I doubt that's the case. The markers mode add some padding to the autoranged axes. This logic is slightly opinionated, and you're not the first one complaining about it not giving the desired results. As I mentioned above, to override this behavior, you can set the axis range. |
|
Same issue is happening for space in left and right side. https://codepen.io/anon/pen/brjGJV Any idea how this can be fixed? |
|
@saimaparveen : I have the same issue (white space on the left and right side) in the "lines+text" mode. Did you solve the issue somehow? "lines" mode: |

|
|
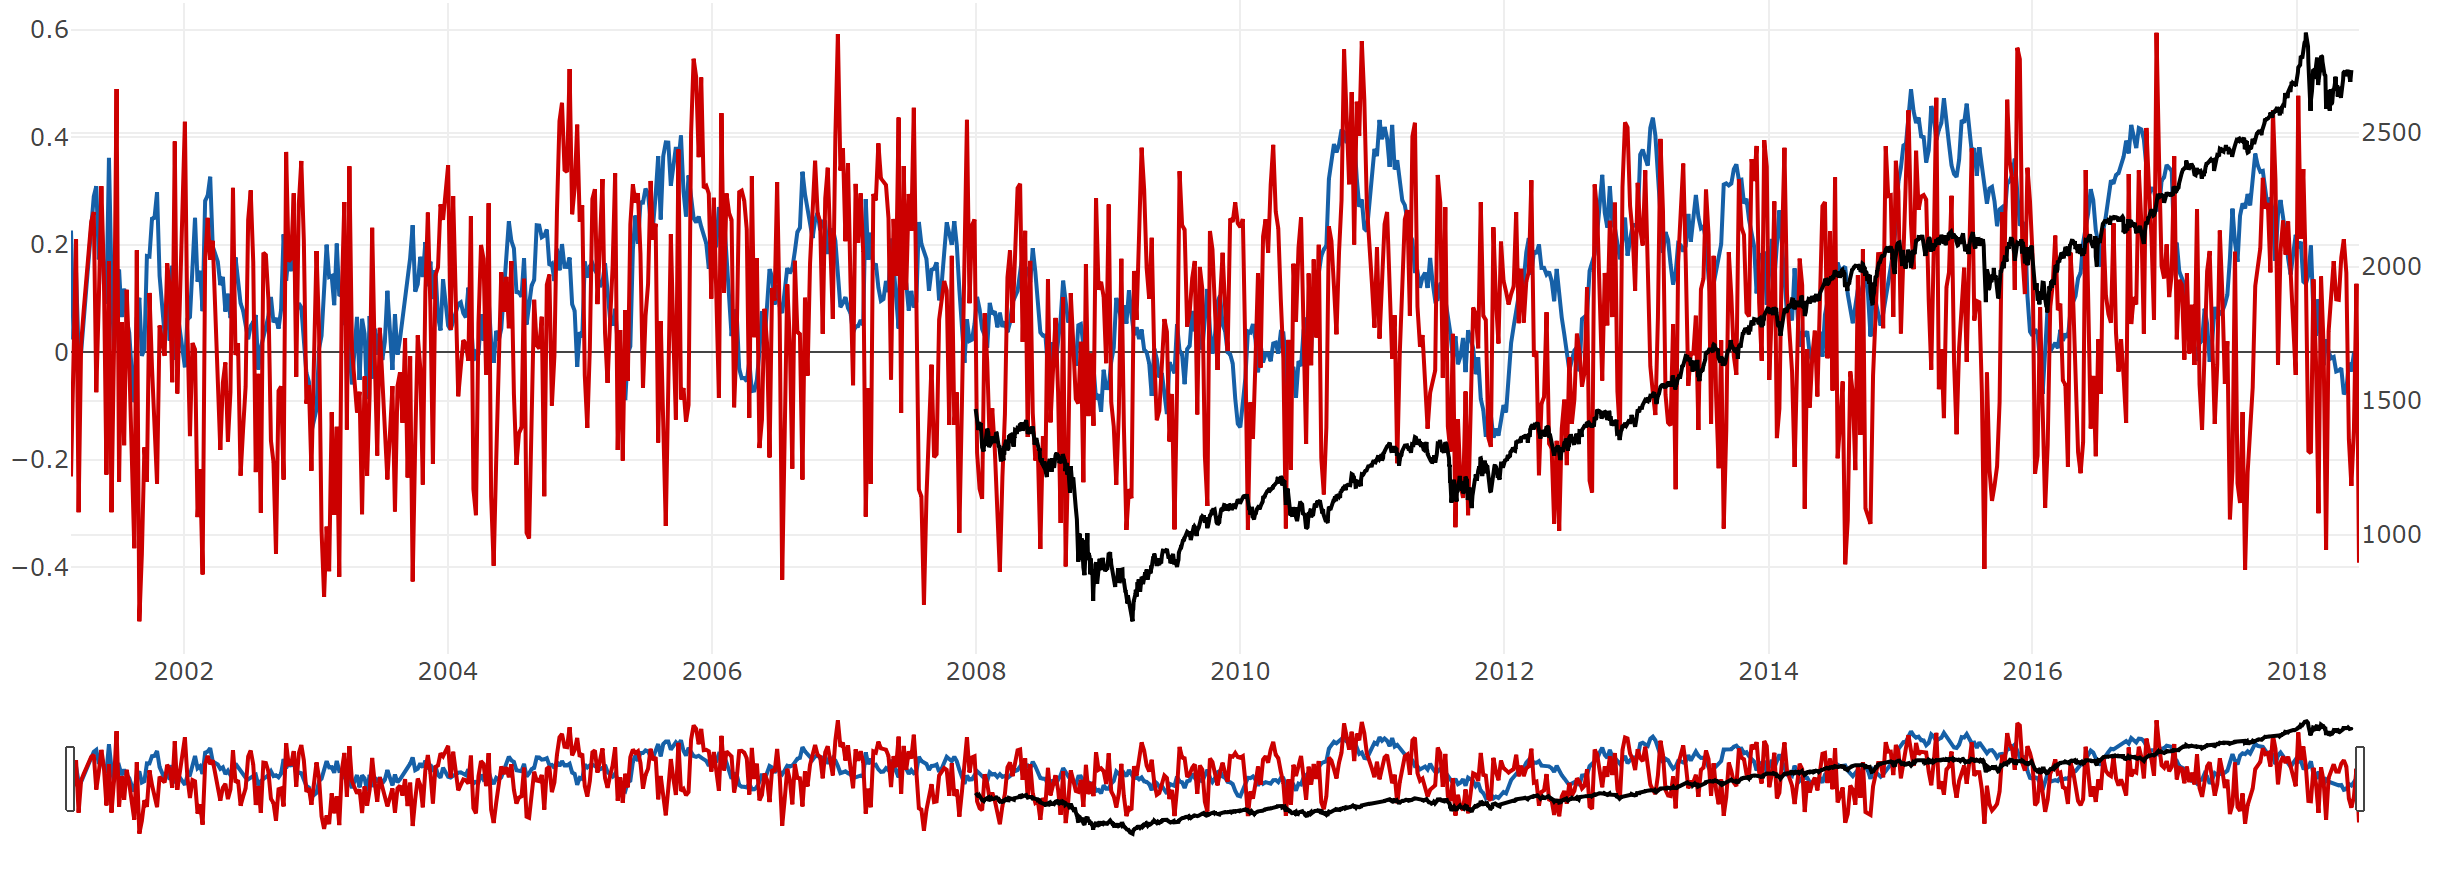
I already set the axis range. However, if I press "All" on the rangeselector, it is showing me the white spaces again.
After clicking the "all" button: |


|
FYI making this whole situation more configurable is being discussed in #1876. That effort, whenever it happens, will include the ability to override this automatic padding. |
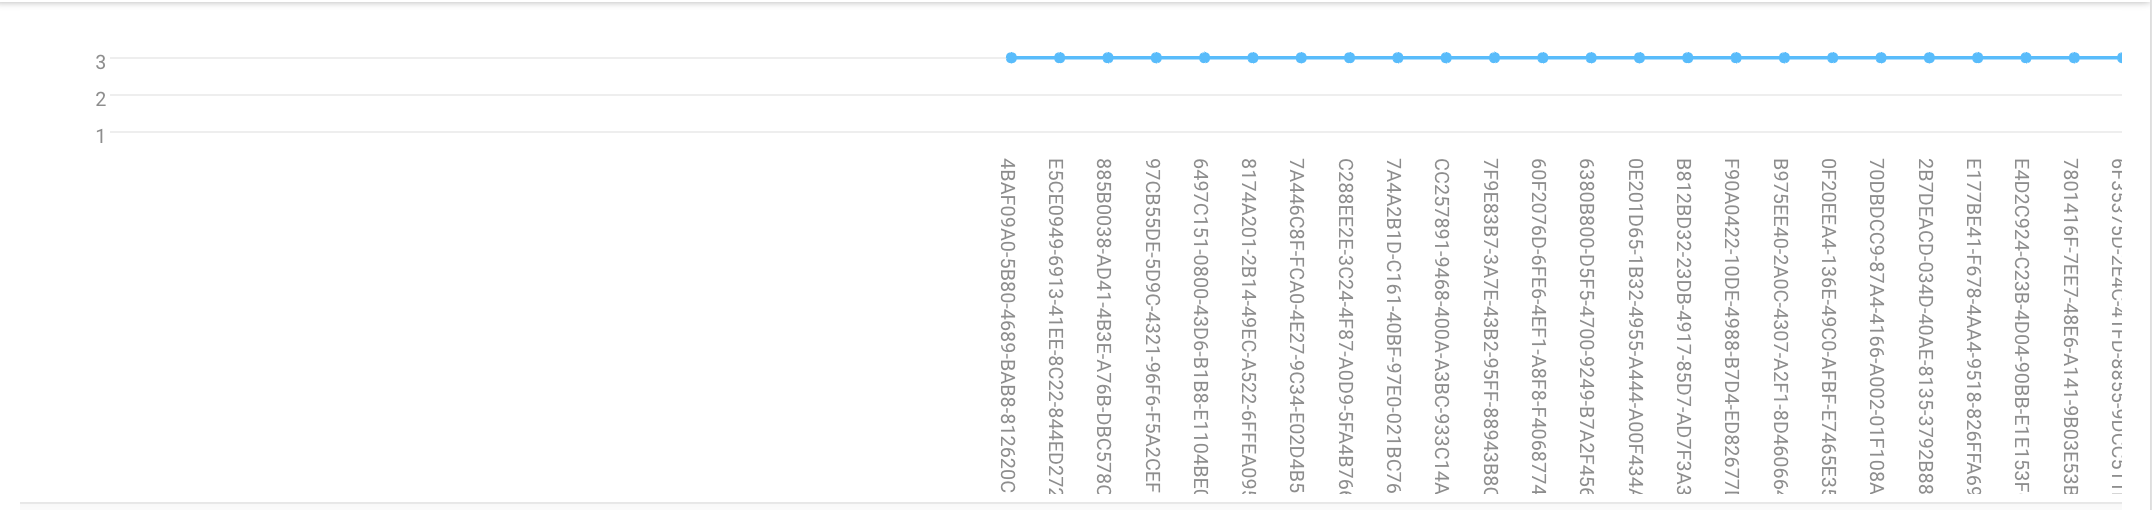
Hi,
Extra space is added at the top and bottom of chart if chart height is more. Any idea how to remove it?

https://codepen.io/saimaparveen/pen/mwVLLL
The text was updated successfully, but these errors were encountered: