Skip to content

DataFrame.boxplot() ignored figsize keyword #11959

New issue

Have a question about this project? Sign up for a free GitHub account to open an issue and contact its maintainers and the community.

By clicking “Sign up for GitHub”, you agree to our terms of service and privacy statement. We’ll occasionally send you account related emails.

Already on GitHub? Sign in to your account

Closed
cswarth opened this issue Jan 5, 2016 · 8 comments
Closed

DataFrame.boxplot() ignored figsize keyword #11959

cswarth opened this issue Jan 5, 2016 · 8 comments
Labels

Comments

@cswarth
Copy link
Contributor

cswarth commented Jan 5, 2016

The DataFrame.boxplot reference documentation says I can change the size of a plot though the figsize keyword, but this appears not to work.

Using df.plot(kind='box') does respect figsize.

import pandas as pd
import numpy as np
import matplotlib.pyplot as plt
import sys

print("pandas version = {}".format(pandas.__version__))
print("python version = {}".format(sys.version))
df = pd.DataFrame(np.random.rand(10, 5), columns=['A', 'B', 'C', 'D', 'E'])
df.plot(kind='box', figsize=(12,8))
plt.show()

df.boxplot(return_type='axes', figsize=(12,8))
plt.show()

screen shot 2016-01-04 at 6 02 34 pm

@TomAugspurger TomAugspurger added this to the 0.18.0 milestone Jan 5, 2016
@TomAugspurger
Copy link
Contributor

Thanks for the report.

We are generally steering people towards the df.plot API, but I think boxplot has a couple quirks that haven't been handled from the .plot(kind=) side.

@cswarth
Copy link
Contributor Author

cswarth commented Jan 6, 2016

Thanks Tom, I just ran across the note about the df.plot API in the 0.17.0 release notes.

This works as expected, and respects the figsize keyword

df.plot.box(return_type='axes', figsize=(12,8))

@jreback jreback modified the milestones: Next Major Release, 0.18.0 Jan 30, 2016
@lermana
Copy link

lermana commented Mar 10, 2017

I also ran into this issue just now (I am using .19 Pandas) when using the boxplot method. But following Tom's advice - using df.plot.box, as opposed to df.boxplot - solved the problem

@JimStearns206
Copy link
Contributor

Two questions:

  • Should boxplot's grid parameter default to True? (see def for boxplot() in _core.py). That does not appear to be the case with df.plot(kind='box').
  • This is likely my newbie error, but:
    -- when I run the test program from PyCharm, df.boxplot() shows the correct (12,8) figsize.
    -- when I run the test program from the command line (i.e. "python test11959.py), df.boxplot() shows a figsize of (6.4, 4.8).
    In both cases I believe the same dev environment pandas is being used (judging by pd.__version__, pd.__file__)

@TomAugspurger
Copy link
Contributor

Should boxplot's grid parameter default to True? (see def for boxplot() in _core.py). That does not appear to be the case with df.plot(kind='box').

I suppose it's been like that for a while. It should probably follow axes.grid...

This is likely my newbie error, but:

I'm not sure why that would be. Keep in mind that the default hasn't changed, df.boxplot just respects it now. Is it possible that its two separate environments with different matplotlib versions? The matplotlib default figsize did change in 2.0

@TomAugspurger
Copy link
Contributor

Closed by #16445

@JimStearns206
Copy link
Contributor

I suppose [boxplot showing grid lines, but plot(kind='box')] has been like that for a while. It should probably follow axes.grid...

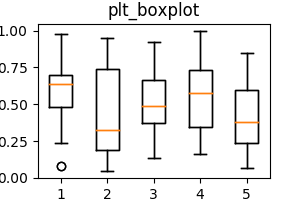
plt.boxplot does not show gridlines by default. df.plot(kind='box') follows that convention, but df.boxplot() does not. Pngs:
plt_boxplot
pd_plot_kind_box
pd_boxplot

Test program attached. Writing the test program revealed some more discrepancies:

  • The color scheme for box border and quartile and median lines differs between matplotlib and pandas. But the color scheme within pandas is consistent, and better IMHO than matplotlib's, so I don't propose changing pandas here.
  • pd.plot() supports keyword arguments such as title. pd.boxplot does not. (See "Side excursion" in attached test program). But neither does plt.boxplot(). So should pd.boxplot be consistent with pd.box(kind='box') or with plt.boxplot()? Dunno - your call.

If you agree that df.boxplot should follow the no grid line default of plt.boxplot(), I'll create an issue and fix it.

If you agree that df.boxplot should support keyword arguments, I'll add that to the same issue or create another issue, and fix that as well.

import matplotlib.pyplot as plt
import numpy as np
# Modify PYTHONPATH appropriately to find pandas development version.
import pandas as pd
import sys

print("pandas version = {}, from={}".format(pd.__version__, pd.__file__))
print("python version = {}".format(sys.version))

def is_grid_on(axes):
    """
    From pandas/tests/plotting/common.py._check_grid_settings._is_grid_on

    :return: True if plot has grid on else False
    """
    xoff = all(not g.gridOn
               for g in axes.xaxis.get_major_ticks())
    yoff = all(not g.gridOn
               for g in axes.yaxis.get_major_ticks())
    return not (xoff and yoff)


dataset = np.random.rand(10,5)
df = pd.DataFrame(dataset, columns=['A', 'B', 'C', 'D', 'E'])
figsize=(3,2)

# Matplotlib boxplot
fig = plt.figure(1, figsize=figsize)
ax = fig.add_subplot(111)
bp = ax.boxplot(dataset)
plt_boxplot = plt.boxplot(dataset)
plt.title("plt_boxplot")  # plt.boxplot() doesn't support title as keywd arg
fig.savefig('plt_boxplot.png')
# plt.show()
assert not is_grid_on(ax)

# Pandas plot(kind='box')
pd_plot_kind_box = df.plot(kind='box', figsize=figsize,
        title="pd_plot_kind_box.png")  # pd.plot() supports title keywd arg
pd_plot_kind_box.get_figure().savefig('pd_plot_kind_box.png')
# plt.show()
assert not is_grid_on(pd_plot_kind_box.axes)

# Pandas boxplot

# Side excursion: df.boxplot doesn't support title parameter. Should it?
try:
    pd_boxplot = df.boxplot(return_type='axes', figsize=figsize,
                            title='pd_boxplot.png')
except TypeError as te:
    assert te.args[0] == "boxplot() got an unexpected keyword argument 'title'"

pd_boxplot = df.boxplot(return_type='axes', figsize=figsize)
plt.title("pd_boxplot.png")
pd_boxplot.get_figure().savefig('pd_boxplot.png')
# plt.show()
assert not is_grid_on(pd_boxplot.axes)

@TomAugspurger
Copy link
Contributor

I'm inclined to just leave it as is for now.

Sign up for free to join this conversation on GitHub. Already have an account? Sign in to comment
Labels
Projects
None yet
Development

No branches or pull requests

5 participants