Skip to content

ClientRead #1774

New issue

Have a question about this project? Sign up for a free GitHub account to open an issue and contact its maintainers and the community.

By clicking “Sign up for GitHub”, you agree to our terms of service and privacy statement. We’ll occasionally send you account related emails.

Already on GitHub? Sign in to your account

Closed
gajus opened this issue Nov 26, 2018 · 21 comments
Closed

ClientRead #1774

gajus opened this issue Nov 26, 2018 · 21 comments

Comments

@gajus
Copy link
Contributor

gajus commented Nov 26, 2018

Perhaps I am misunderstanding something, but I am seeing a lot of ClientRead waits.

screenshot 2018-11-26 at 22 26 10

Above: A screenshot of AWS RDS Performance Insights.

If I am understanding this correctly, ClientRead is PostgreSQL server waiting for the client to submit to parameters, i.e. is this node-postgres taking its time to encode the parameters before sending them to the server?

Whats odd is that in case of the particular queries highlighted in the AWS RDS Performance Insights report, the input parameter is a single integer.


Might be unrelated to the above issue, but earlier I have observed that some queries are occasionally hanging in the ClientRead state, e.g.

applaudience=> SELECT
applaudience->   psa1.pid,
applaudience->   now() - psa1.query_start duration,
applaudience->   psa1.query,
applaudience->   psa1.*
applaudience-> FROM pg_stat_activity psa1
applaudience-> WHERE
applaudience->   psa1.state = 'active' AND
applaudience->   psa1.query_start < now() - interval '1 minute'
applaudience-> ORDER BY psa1.query_start ASC;
  pid   |    duration     |                                                                           query                                                                           | datid |   datname    |  pid   | usesysid | usename  |    application_name     |  client_addr   | client_hostname | client_port |         backend_start         |          xact_start           |          query_start          |         state_change          | wait_event_type | wait_event | state  | backend_xid | backend_xmin |                                                                           query                                                                           |  backend_type
--------+-----------------+-----------------------------------------------------------------------------------------------------------------------------------------------------------+-------+--------------+--------+----------+----------+-------------------------+----------------+-----------------+-------------+-------------------------------+-------------------------------+-------------------------------+-------------------------------+-----------------+------------+--------+-------------+--------------+-----------------------------------------------------------------------------------------------------------------------------------------------------------+----------------
 107485 | 01:39:33.952415 | SELECT id, location_row "row", location_column "column", foreign_cinema_seat_type_id "foreignCinemaSeatTypeId", name FROM seat WHERE seating_plan_id = $1 | 16390 | applaudience | 107485 |    16389 | postgres | data-management-program | 35.189.208.139 |                 |       43582 | 2018-11-26 18:01:57.283608+00 | 2018-11-26 18:05:04.010779+00 | 2018-11-26 18:05:04.011016+00 | 2018-11-26 18:05:04.011018+00 | Client          | ClientRead | active |             |    762082063 | SELECT id, location_row "row", location_column "column", foreign_cinema_seat_type_id "foreignCinemaSeatTypeId", name FROM seat WHERE seating_plan_id = $1 | client backend
 107000 | 01:39:33.93314  | SELECT id, location_row "row", location_column "column", foreign_cinema_seat_type_id "foreignCinemaSeatTypeId", name FROM seat WHERE seating_plan_id = $1 | 16390 | applaudience | 107000 |    16389 | postgres | data-management-program | 35.189.208.139 |                 |       43400 | 2018-11-26 18:01:28.878422+00 | 2018-11-26 18:05:04.030169+00 | 2018-11-26 18:05:04.030291+00 | 2018-11-26 18:05:04.030292+00 | Client          | ClientRead | active |             |    762082063 | SELECT id, location_row "row", location_column "column", foreign_cinema_seat_type_id "foreignCinemaSeatTypeId", name FROM seat WHERE seating_plan_id = $1 | client backend
 106686 | 01:39:33.853763 | SELECT id, location_row "row", location_column "column", foreign_cinema_seat_type_id "foreignCinemaSeatTypeId", name FROM seat WHERE seating_plan_id = $1 | 16390 | applaudience | 106686 |    16389 | postgres | data-management-program | 35.195.228.15  |                 |       52444 | 2018-11-26 18:01:20.318759+00 | 2018-11-26 18:05:04.109547+00 | 2018-11-26 18:05:04.109668+00 | 2018-11-26 18:05:04.109669+00 | Client          | ClientRead | active |             |    762082063 | SELECT id, location_row "row", location_column "column", foreign_cinema_seat_type_id "foreignCinemaSeatTypeId", name FROM seat WHERE seating_plan_id = $1 | client backend
 107439 | 01:39:33.560846 | SELECT id, location_row "row", location_column "column", foreign_cinema_seat_type_id "foreignCinemaSeatTypeId", name FROM seat WHERE seating_plan_id = $1 | 16390 | applaudience | 107439 |    16389 | postgres | data-management-program | 35.189.208.139 |                 |       43554 | 2018-11-26 18:01:52.603207+00 | 2018-11-26 18:05:04.40246+00  | 2018-11-26 18:05:04.402585+00 | 2018-11-26 18:05:04.402586+00 | Client          | ClientRead | active |             |    762082063 | SELECT id, location_row "row", location_column "column", foreign_cinema_seat_type_id "foreignCinemaSeatTypeId", name FROM seat WHERE seating_plan_id = $1 | client backend
(4 rows)

Is anyone familiar with this?

@gajus
Copy link
Contributor Author

gajus commented Jan 4, 2019

I raised the same question with AWS support.

Here is the response:

Hello.

Thanks for reaching out to AWS Premium Support. I'm Raphael and I'll be assisting you with this case.

I understand you see the event Client:ClientRead in Performance Insights and would like more details on that.

The PostgreSQL documentation link[1] you shared is accurate where it says "Waiting to read data from the client." It would not be an idle event though, it actually means that a database session is receiving data from an application client.

Just a quick example of how this could come up: I noticed some of the queries in the screenshot use bind variables. The simple action of passing parameters (actual values) to the bind variables could be a ClientRead event, and so on.

Lastly, just to clarify, it would not be a CPU wait but rather a client-to-DB session wait. The ticked "vCPU" button will only mark the threshold (dotted line) of how many vCPUs your database has got, which is 16 since your instance "father" is a db.r4.4xlarge[2].

Please let me know if you have additional questions. I'd be glad to help.

Have a great day and happy new year!

References:
[1] https://www.postgresql.org/docs/10/monitoring-stats.html
[2] https://docs.aws.amazon.com/AmazonRDS/latest/UserGuide/Concepts.DBInstanceClass.html#Concepts.DBInstanceClass.Summary

Best regards,

Raphael G.
Amazon Web Services

@gajus
Copy link
Contributor Author

gajus commented Jan 4, 2019

@brianc Do you have experience with the above?

Looking at the dashboard, the ClientRead constitutes by far the longest wait in the query execution breakdown. I am wondering if this is node-postgres specific or if this could be (e.g.) network latency?

@gajus
Copy link
Contributor Author

gajus commented Jan 4, 2019

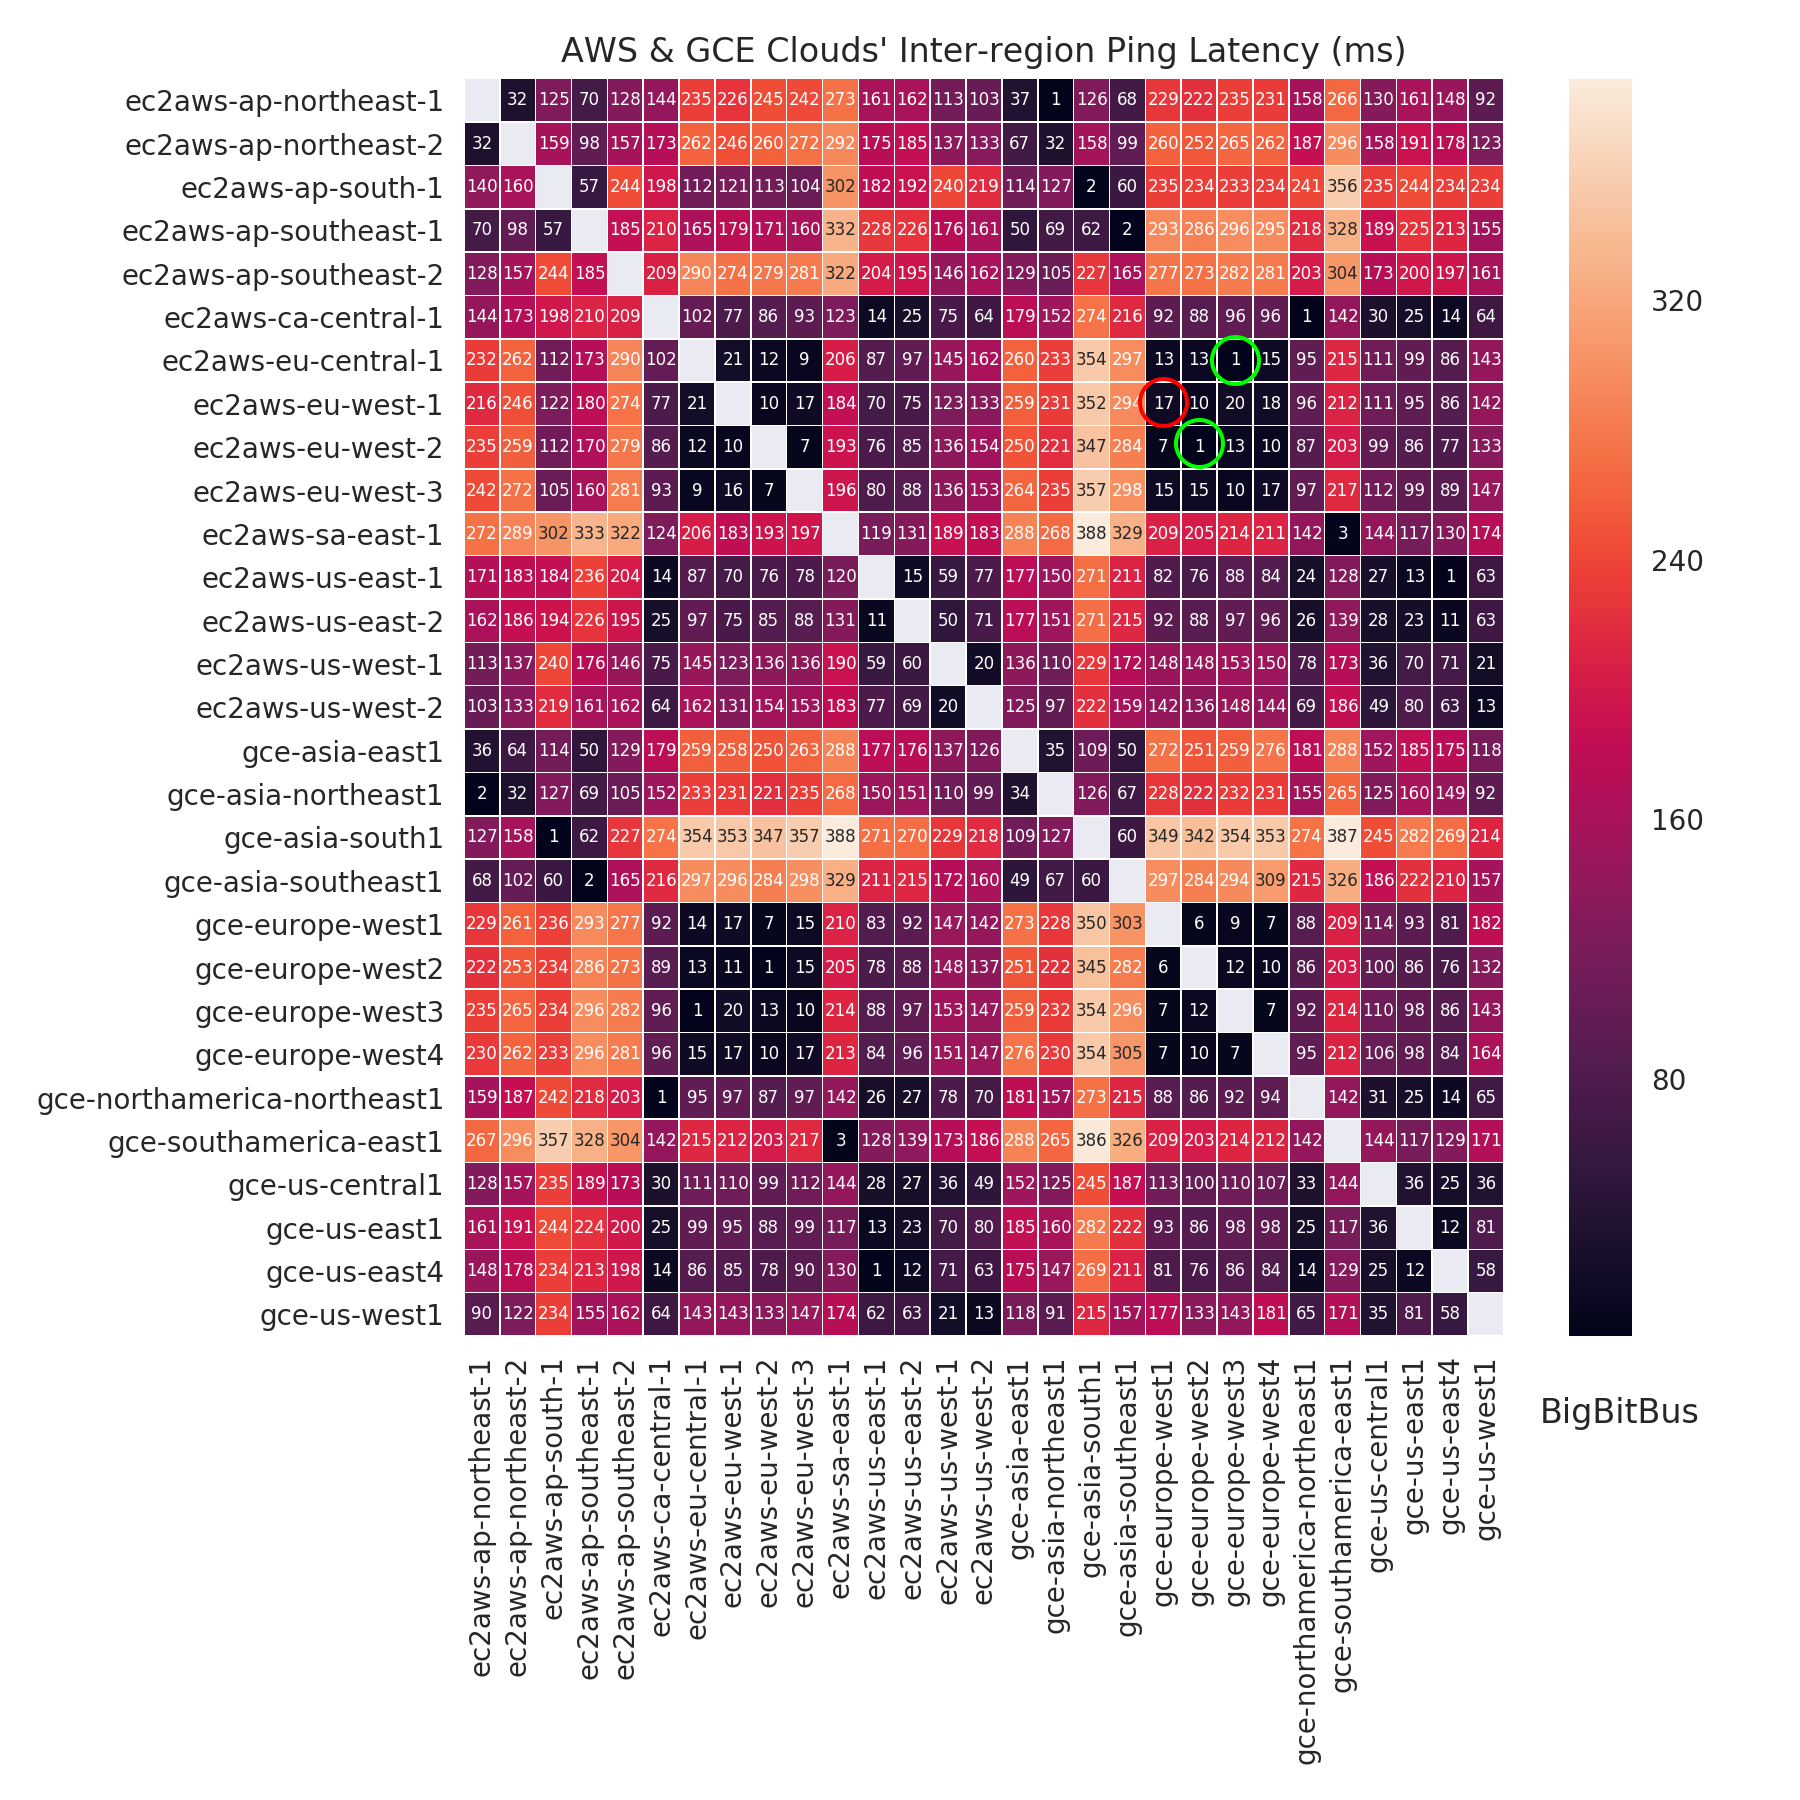
I did a bit of digging and found out that the latency between the DCs that we are using is 17ms (red circle), and that there are 2 other DC combinations that have sub 1ms latency.

gce-aws-latency

Will perform the migration overnight and report if it affects the ClientRead waits.

@brianc
Copy link
Owner

brianc commented Jan 4, 2019

Hmmm I don't have experience with that, but I'll look at the code real quick right now & see if anything stands out to me.=

@brianc
Copy link
Owner

brianc commented Jan 4, 2019

Just a bit on how the driver / protocol work:

When you submit a query pg checks to see if it needs to be prepared:

https://github.com/brianc/node-postgres/blob/master/lib/query.js#L154

If the query needs preparation it results in a couple extra packets being sent:

First (usually) parse:
https://github.com/brianc/node-postgres/blob/master/lib/query.js#L185
Then bind:
https://github.com/brianc/node-postgres/blob/master/lib/query.js#L197
Then describe:
https://github.com/brianc/node-postgres/blob/master/lib/query.js#L204
Execute:
https://github.com/brianc/node-postgres/blob/master/lib/query.js#L171
And finally flush:
https://github.com/brianc/node-postgres/blob/master/lib/query.js#L175

All these messages are written to a single buffer & pushed into the socket at once on the client-side of things. Looking I don't see any place where significant latency would be introduced there...but, it definitely performs a lot more work than doing a non-parameterized query.

2 things you could try:

  1. temporarily replace the query with a non-parameterized version - does the issue go away? Does overall query throughput increase significantly?
  2. use a prepared statement - I don't expect this to have big impact but would be worth a look, if you have time.

Lemme know if there's anything in particular you want me to look at!

@gajus
Copy link
Contributor Author

gajus commented Jan 4, 2019

Thank you.

I am migrating our services to another DC tonight. Will evaluate what/ if any impact it has. If the improvement is not significant enough, will attempt to experiment with the suggested changes.

Based on what you have described, given that there is only a single round-trip per query, I doubt the issue is anything to-do with the node-postgres implementation. I could see this being the case only if evaluating a query with parameters would involve multiple round-trips (such as: 1) prepare the statement; 2) (wait for the statement creation and) send parameters).

@gajus
Copy link
Contributor Author

gajus commented Jan 5, 2019

Turns out ClientRead is entirely related to the latency.

screenshot 2019-01-05 at 15 49 29

I have migrated our worker nodes to the same DC where the database is located and the ClientRead waits have practically disappeared.

@gajus gajus closed this as completed Jan 5, 2019
@justColbs
Copy link

I'm having this same exact issue. I have high latency here and there (4s-20s) and my ClientRead looks similar to yours, maybe a bit less over the limit. @gajus Could you clarify what a "DC" is? Database Connection?

Thanks!

@gajus
Copy link
Contributor Author

gajus commented Feb 18, 2020

DC = data center

@tinder-ydong
Copy link

I had the same issue, after switching to pg-native, it reduced the ClientRead cost by 70%

@madacol
Copy link

madacol commented Jul 7, 2020

Disclaimer: Not directly related to this issue, I'm not using AWS.
I just noticed my queries were too slow.


Switching to pg-native reduced query-time to ~50%

pg-native

137.058 ms
171.876 ms
183.515 ms
150.064 ms
155.257 ms
138.460 ms
155.180 ms

pg

316.464 ms
308.358 ms
269.925 ms
362.816 ms
294.851 ms
453.559 ms

My query is very simple, and if speed difference with pg-native is always so significant, then maybe this should be put in the docs (couldn't find it!)

@brianc
Copy link
Owner

brianc commented Jul 7, 2020

@madacol this is only due to an issue I haven't been able to track down yet. Do you have a self-contained way to reproduce this? Most reports showed this was happening only in a data center. If you have steps to reproduce that'd help me track it down significantly. (in all my local benchmarks pg is actually faster than pg-native)

@madacol
Copy link

madacol commented Jul 7, 2020

My DB is in Google Cloud and I'm using pg version 8.2.1

This is roughly what I'm doing to measure time

import { Pool } from 'pg';

const pool = new Pool({
    connectionString: process.env.DATABASE_URL,
    query_timeout: 10000,
    max: 6,
    idleTimeoutMillis: 30000,
    connectionTimeoutMillis: 5000,
})

...


    console.time('latestDB');
    const { rows } = await pool.query(
        'SELECT symbol, name, "namePlural", flag, code, buy, sell, lobit_prices.created_at AS date\
            FROM lobit_prices\
            JOIN currencies ON lobit_prices.currency_id = currencies.id\
            WHERE code = $1\
            ORDER BY lobit_prices.created_at DESC\
            LIMIT 1',
        ['usd']
    );
    console.timeEnd('latestDB');

full code is here:
https://github.com/madacol/bolivarparalelo/blob/dda8dfd0993292e5f65c7fd6f4e9ed9fd33722bf/src/api.js
https://github.com/madacol/bolivarparalelo/blob/dda8dfd0993292e5f65c7fd6f4e9ed9fd33722bf/src/db.js

@madacol
Copy link

madacol commented Jul 7, 2020

I just made same measurements with a local DB, a little less difference but still significant

pg-native

1.510 ms
1.161 ms
1.374 ms
1.303 ms
1.498 ms
1.133 ms
1.201 ms

pg

1.527 ms
1.916 ms
1.789 ms
1.923 ms
2.259 ms
2.029 ms
3.036 ms

I can give you a dump of this local DB, if you'd like

@verkhoro
Copy link

verkhoro commented Jul 8, 2020

Hey @brianc , I am working with @nwjsmith who opened #2189. We switched to pg-native and the client read was gone. We also saw a drop in DB load.

Before
before

After
after

CPU drop:
cpu

I am not sure if we measured query time.

We are using knex. There must be something wrong with the way knex is using pg driver or the way we use knex, but I couldn't pinpoint the issue.

One thing that comes to mind is that we do other things in transaction like writing logs, submitting metrics, and datadog tracing. Each metric results in a sync network call to an agent on the host. Maybe pg and pg-native handle this case differently?

We also use async/await in more places than we should. Can this be a problem in transactions if event loop is overloaded with other work?

@brianc
Copy link
Owner

brianc commented Jul 8, 2020

This is really troubling to me...this has cropped up from time to time & I've never been able to reproduce. I'll put this high on my list of priorities to do another, deeper investigation into it. I'll try to simulate slower connections or connect to remote databases & see if I can get more info. As an aside...what tool are you using to graph ClientRead?

@brianc
Copy link
Owner

brianc commented Jul 8, 2020

Another thing that would be helpful if you have the time is to fork the repo & run a local fork & modify the code to see if you can shake out where the perf difference might be?

@gajus
Copy link
Contributor Author

gajus commented Jul 8, 2020

As an aside...what tool are you using to graph ClientRead?

That looks like AWS dashboard.

@verkhoro
Copy link

verkhoro commented Jul 9, 2020

As an aside...what tool are you using to graph ClientRead?

Yeah, this is AWS RDS Performance Insights. We've moved to Aurora since then.

Another thing that would be helpful if you have the time is to fork the repo & run a local fork & modify the code to see if you can shake out where the perf difference might be?

Converting the benchmark to knex with async/await syntax is probably the best strategy. I'll see if I can get to it. I also plan to trace the impact of metrics calls

@rarkins
Copy link
Contributor

rarkins commented Oct 7, 2020

I'm also seeing high ClientRead waits when observing using RDS Performance Insights. My clients are running on AWS Lambda so I don't think possible to run pg-native?

@ohjeyong
Copy link

For me, it is completely solved by upgrading to 8.5.1

Sign up for free to join this conversation on GitHub. Already have an account? Sign in to comment
Labels
None yet
Projects
None yet
Development

No branches or pull requests

8 participants